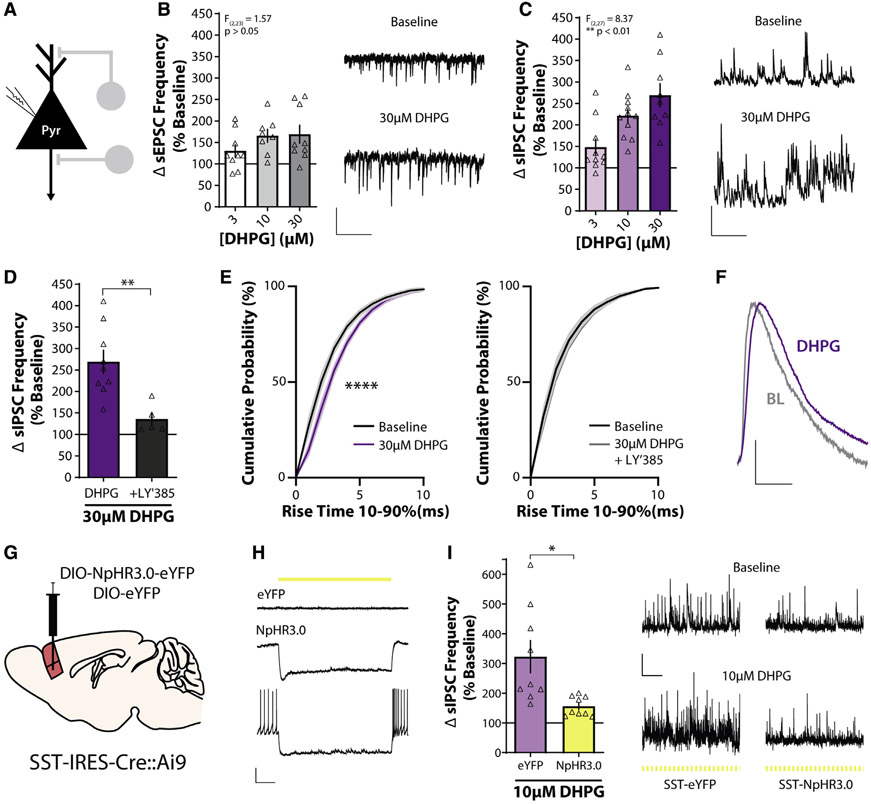
Figure 3. SST interneurons mediate mGlu1 receptor activation-induced increases in PL PFC inhibitory transmission.
(A) Schematic depicting whole-cell recording of layer V pyramidal neuron.
(B) (Left) Change in sEPSC frequency in layer V pyramidal neurons in response to bath application of DHPG expressed as a percentage of baseline (one-way ANOVA main effect of DHPG concentration, F(2,23) = 1.57, p = 0.23, n/N = 9/4, 8/6, and 9/6 cells/mouse for 3, 10, and 30 μM DHPG). (Right) Sample traces showing sEPSCs recorded in voltage clamp at −70 mV during baseline and in the presence of 30 μM DHPG. All experiments were conducted in the constant presence of the mGlu5 negative allosteric modulator MTEP (3 μM). Scale bars, 20 pA, 500 ms.
(C) (Left) DHPG induces a concentration-dependent increase in sIPSC frequency in response to bath application of DHPG (one-way ANOVA main effect of DHPG concentration, F(2,27) = 8.37, p = 0.0015, n/N = 10/8, 11/9, and 9/6 for 3, 10, and 30 μM DHPG). (Right) Sample traces showing sIPSCs recorded in voltage clamp at +10 mV during baseline and in the presence of 30 μM DHPG. Scale bars, 50 pA, 500 ms.
(D) The mGlu1 antagonist LY367385 (100 μM) blocks the increase in sIPSC frequency induced by 30 μM DHPG (two-tailed unpaired Student’s t test, p = 0.0047, n/N = 9/6 for DHPG, 5/2 for +LY′385).
(E) Cumulative probability plots of sIPSC rise time during baseline and after bath application of 30 μM DHPG alone (left; two-way repeated-measures ANOVA, main effect of drug, F(1,88) = 67.5, p < 0.0001) or in the presence of 100 μMLY367385 (right; two-way repeated measures ANOVA, main effect of drug, F(1,44) = 2.65, p = 0.11).
(F) Scaled: average sIPSCs at baseline (BL) and after 30 μM DHPG from representative traces in (C). Scale bars, scaled amplitude, 10 ms.
(G) Schematic depicting approach for viral-mediated expression of NpHR3.0-EYFP or EYFP in mPFC SST-INs.
(H) Representative current-clamp recordings from control EYFP-infected (top) or NpHR3.0-EYFP-infected (middle and bottom) SST-INs. Delivery of 565-nm light is depicted by the yellow line.
(I) (Left) 565-nm light (100-ms duration, 5 Hz) blocks the DHPG-induced increase in sIPSC frequency in NpHR3.0-expressing slices, but not EYFP-expressing slices (two-tailed unpaired Student’s t test with Welch’s correction, p = 0.015, n/N = 9/3 for EYFP, 9/5 for NpHR3.0). (Right) Sample traces showing sIPSCs during baseline and 10 μM DHPG in pulsed yellow light in control and NpHR3.0-infected slices. Scale bars, 50 pA, 2 s. *p < 0.05, **p < 0.01.
Data are represented as mean ± SEM. See also Figure S3.

