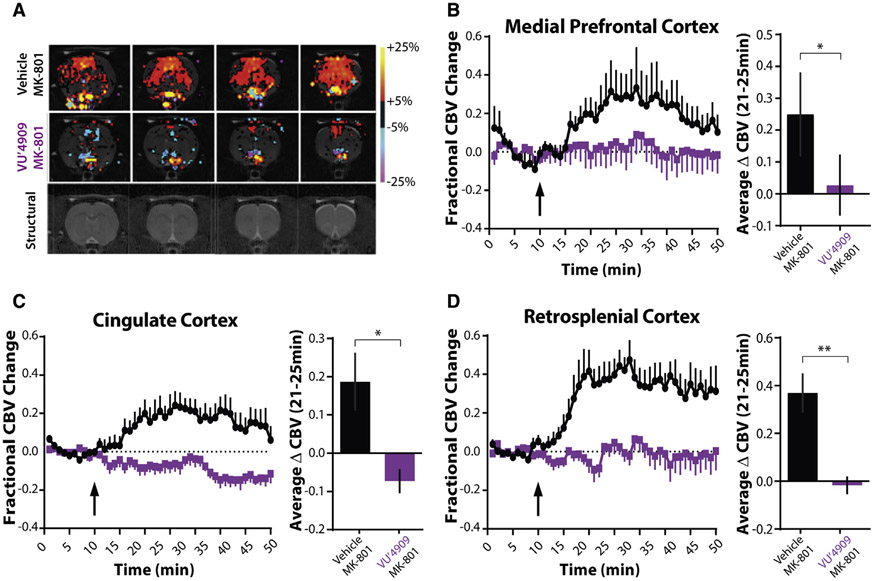
Figure 5. mGlu1 potentiation reverses NMDA receptor antagonist-induced cortical hyperactivity.
(A) Representative cerebral blood volume (CBV) and structural T2-weighted MRI template images of male Sprague-Dawley rats anesthetized and then treated with vehicle or 60 mg/kg VU6004909 (i.p., 10% Tween 80) and then 0.3 mg/kg MK-801 (s.c., 0.9% saline). In the group activation maps, the red to yellow bar range represents increased CBV, indicating increased neuronal activity, while the blue to purple color bar range represents decreased CBV, indicating decreased neuronal activity compared to the pre-drug baseline period.
(B–D) Time courses and bar graphs of CBV changes after MK-801 injection (arrow) in rats pretreated with vehicle or VU6004909 from (B) medial prefrontal cortex (mPFC), (C) cingulate cortex (Cg), or (D) retrosplenial cortex (RSC). Time courses show fractional changes in CBV (ΔCBV(t)/CBVo). For bar graphs, fractional CBV values were averaged between 21 and 25 min for each animal. VU6004909 blocks the MK-801-induced increase in fractional CBV across multiple cortical areas (two-tailed Mann-Whitney test; mPFC, p = 0.041; Cg, p = 0.015; RSC, p = 0.0043; N = 6 rats per group). *p < 0.05, **p < 0.01.
Data are represented as mean ± SEM. See also Figure S5.

