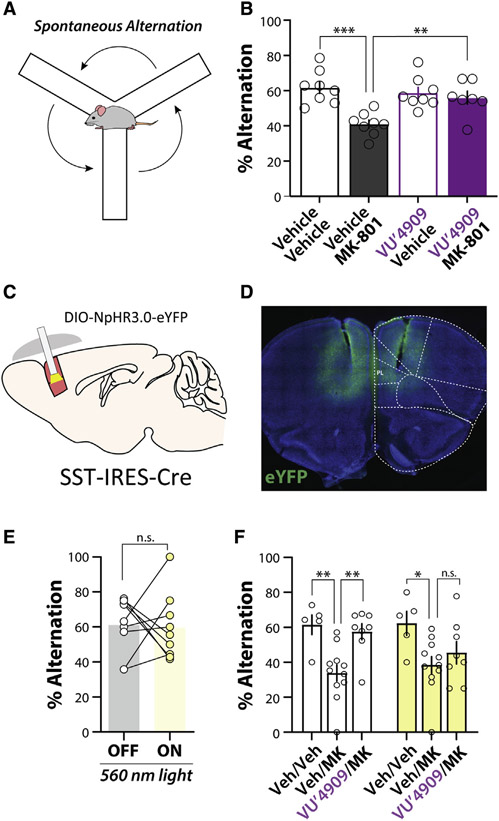
Figure 6. The mGlu1 PAM VU6004909 reverses an MK-801-induced working memory deficit via actions on PL PFC SST interneurons.
(A) Schematic of spontaneous alternation in the Y-maze.
(B) Average % spontaneous alternation in mice pretreated with vehicle or 60 mg/kg VU6004909 (i.p., 10% Tween 80) prior to administration of vehicle or 0.18 mg/kg MK-801 (i.p., 0.9% saline) 20 min before behavioral test. MK-801 impairs spontaneous alternation and this deficit is reversed by VU6004909 (one-way ANOVA main effect, F(3,27) = 8.99, p = 0.0003; post hoc Bonferroni’s test: vehicle/vehicle versus vehicle/MK-801, p = 0.0002; vehicle/MK-801 versus VU′4909/MK-801, p = 0.0077; vehicle/vehicle versus VU′4909/vehicle, p = 1.00; N = 8 mice for vehicle/vehicle, 8 for vehicle/MK-801, 8 for VU′4909/vehicle, and 7 for VU′4909/MK-801).
(C) Schematic depicting strategy to optogenetically inhibit SST-INs in vivo.
(D) Representative image of bilateral NpHR3.0-EYFP expression throughout the mPFC and bilateral fiber tracts terminating in the PL PFC.
(E) No effect of PL PFC SST-IN inhibition on spontaneous alternation in the Y-maze. SST-NpHR mice underwent an 8-min trial with 4 min of light ON and 4 min of light OFF, randomized to either receive ON first or OFF first (see Figure S6). No effect of light order was observed; therefore, data are presented as pooled OFF and ON trials (two-tailed paired t test, p = 0.88, N = 9).
(F) Inhibiting PL PFC SST-INs blocks the ability of VU6004909 to reverse MK-801-induced deficits in the Y-maze. Effect is shown of 560-nm light on Y-maze performance in mice dosed with vehicle, 0.18 mg/kg MK-801 (i.p., 0.9% saline), or 60 mg/kg VU6004909 (i.p., 10% Tween 80) pretreated before MK-801. White bars represent performance during light OFF trials, and yellow bars represent performance during light ON trials (two-way repeated measures ANOVA, main effect of drug, F(2,21) = 9.33, p = 0.0013; post hoc Bonferroni’s multiple comparisons test: OFF trials, vehicle/vehicle versus vehicle/MK-801, p = 0.0037; vehicle/MK-801 versus VU′4909/MK-801, p = 0.0039; ON trials, vehicle/vehicle versus vehicle/MK-801, p = 0.013; vehicle/MK-801 versus VU′4909/MK-801, p = 0.67; N = 5 for vehicle/vehicle, 11 for vehicle/MK-801, and 8 for VU′4909/MK-801). *p < 0.05, **p < 0.01.
Data are represented as mean ± SEM. See also Figure S6.

