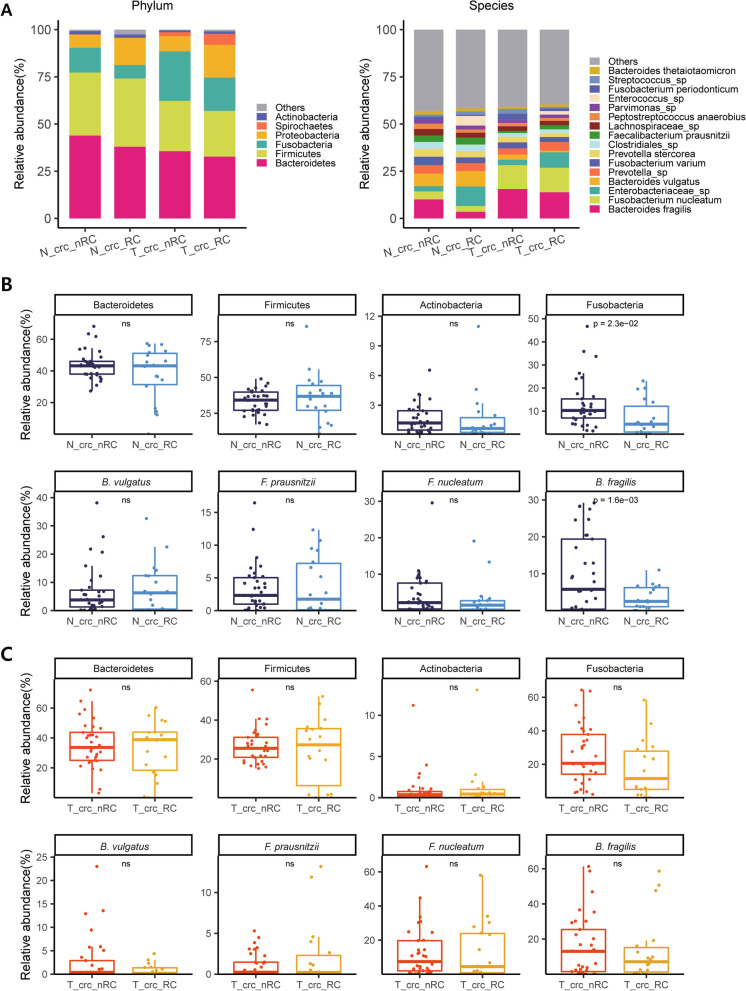
Fig. 5.
Comparison of the microbiome composition in four different tissue types. a Patients were divided into four subgroups by adding prognostic information that was retrospectively determined (RC: recurrence; nRC: nonrecurrence), accompanied by normal tissue- and tumor-derived microbiomes, i.e., ‘N_crc_RC’, ‘N_crc_nRC’, ‘T_crc_RC’, and ‘T_crc_nRC’, as described in the main text. Differences in microbial composition are displayed at the phylum (left) and species levels (right). b Box plot analysis of the relative abundance of selected OTUs at the phylum level (top) and the species level (bottom) between ‘N_crc_RC’ and ‘N_crc_nRC’. c Box plot analysis of the relative abundance of selected OTUs at the phylum level (top) and the species level (bottom) between ‘T_crc_RC’ and ‘T_crc_nRC’. a, b The samples used were derived from a total of 33 ‘crc_nRC’ and 18 ‘crc_RC’ samples for both normal and tumor samples (Additional file 1: Table S1)

