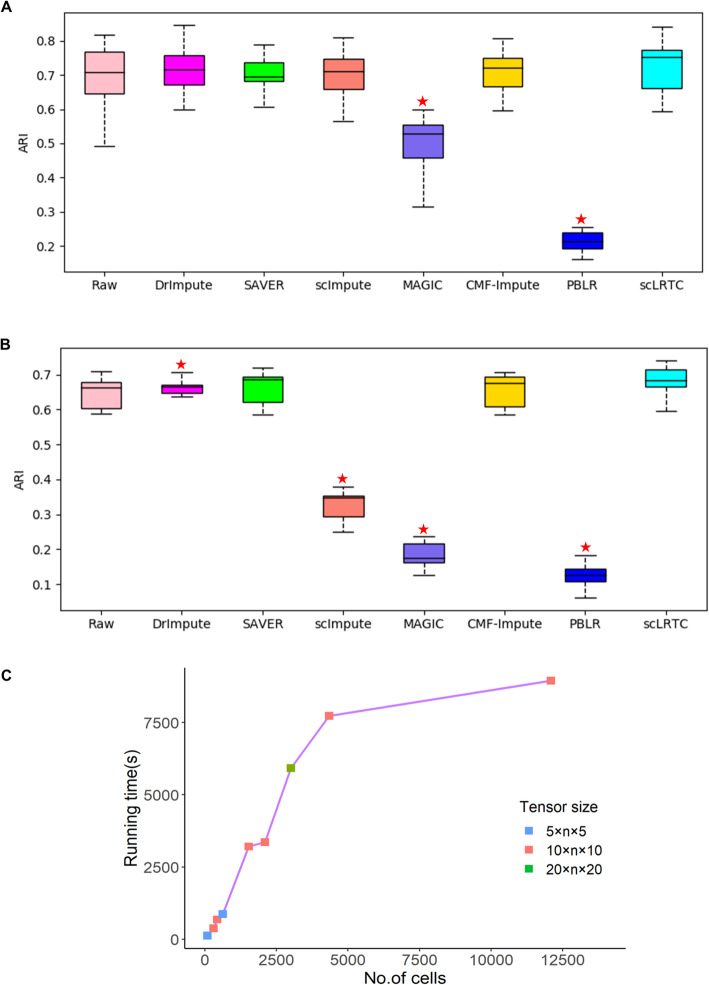
Fig. 2.
Performance analysis and comparison of scLRTC and other methods by the t-SNE + K-means clustering. (A) ARI obtained by t-SNE + K-means clustering on the Pollen dataset using different algorithms. (B) ARI obtained by t-SNE + K-means clustering on the Usoskin dataset using different algorithms. In (A) and (B), asterisk indicates the statistically significant difference (P < 0.05) between scLRTC and the imputation method of interest using the Wilcoxon rank-sum test. (C) Running time of scLRTC for datasets with different sample sizes. The different tensor size setting is represented by different colors, where n is the number of genes

