Fig. 1.
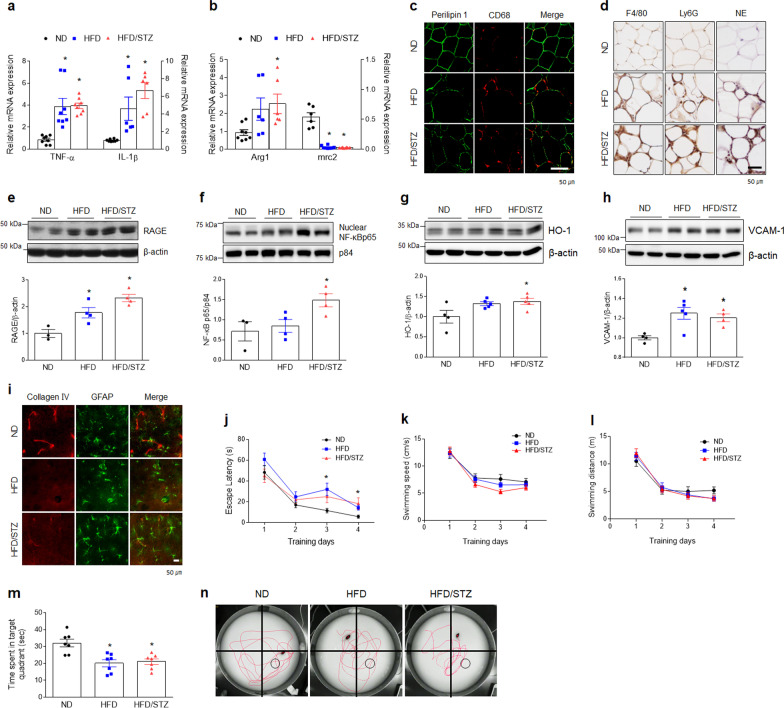
Systemic inflammation and neuroinflammation are associated with HFD- or HFD/STZ-induced diabetic mice with memory deficits. a, b Expressions of mRNA encoding TNF-α (F = 14.85, p < 0.001), IL-1β (F = 12.71, p < 0.001), Arg1 (F = 4.039, p = 0.037), and mrc2 (F = 66.75, p < 0.001) in adipose tissue were measured by quantitative RT-PCR (n = 6–8). c Representative immunofluorescence staining for perilipin 1 and CD68 in adipose tissue sections. CD68-positive macrophages are arranged in crown-like structures (CLSs) around necrotic perilipin1-free adipocytes in HFD-fed mice with or without STZ (n = 3–4). d Representative images showing CLSs in adipose tissue. Immunohistochemical staining for macrophage-specific F4/80, neutrophil-specific Ly6G, and NE are colored brown. All sections were counterstained with hematoxylin (n = 3–4). e–h Western blots and quantified hippocampal RAGE e (F = 14.78, p = 0.002), nuclear NF-κBp65 f (F = 5.173, p = 0.036), HO-1 g (F = 4.304, p = 0.042), and VCAM-1 h (F = 7.729, p = 0.009). To normalize total and nuclear protein levels, β-actin and p84 were used, respectively. Data (n = 3–5) are shown as mean ± SEM. i Representative immunofluorescence staining for collagen IV (vascular marker) and GFAP (a marker for astrocyte) in the hippocampal CA1 regions (n = 3–4). j–n Escape latency j (F = 3.261, p = 0.045), Swimming speed k (F = 0.72, p = 0.691), and Swimming distance l (F = 1.104, p = 0.359) over four days of Morris water maze training, Time in the target platform quadrant m (n = 7, F = 10.76, p < 0.001), n Representative swim paths during the probe trial. Circle boxes indicate the location of the hidden platform. The indicated p values represent a one-way ANOVA followed by Tukey’s post-hoc test. *p < 0.05, versus ND. †p < 0.05, versus HFD

