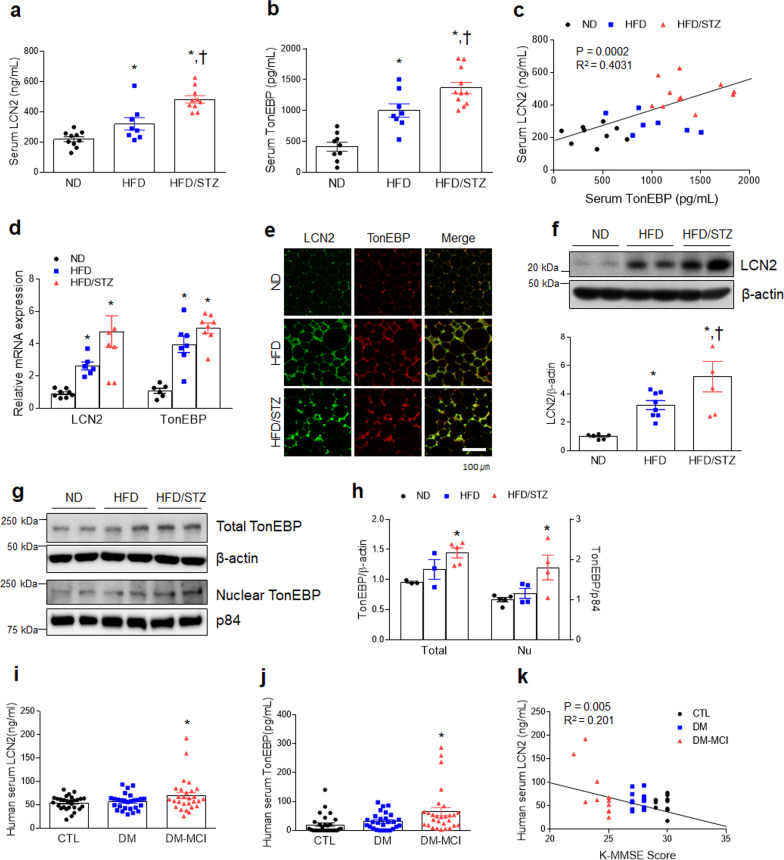
Fig. 2.
LCN2 and TonEBP are markedly increased in experimental diabetic mice and diabetic patients. a, b Serum LCN2 a (F = 21.43, p < 0.001) and TonEBP b (F = 28.9, p < 0.001) levels were measured using ELISAs (n = 8–11). c Correlation between serum LCN2 and TonEBP levels (n = 7–11). d Expression of LCN2 (F = 9.924, p < 0.001) and TonEBP (F = 25.6, p < 0.001) mRNA in adipose tissue (n = 6–8). e Representative immunofluorescence staining for TonEBP and LCN2 in adipose tissue sections (n = 3–4). f Western blots and quantified hippocampal expression of LCN2 (n = 5–8, F = 11.21, p < 0.001). Band intensities were normalized to β-actin. g, h Western blots and quantified hippocampal expression of total TonEBP (n = 3–5, F = 6.234, p = 0.023) and nuclear TonEBP (n = 4–5, F = 5.566, p = 0.024). To normalize the total and nuclear protein levels, β-actin and p84 were used, respectively. i, j Circulating LCN2 i (F = 3.391, p = 0.039) and TonEBP j (F = 4.527, p = 0.014) levels in control (CTL), diabetes (DM), and DM + mild cognitive impairment (MCI) subject samples were measured using ELISAs (n = 27–29). k Correlation between serum LCN2 and Korean Mini Mental State Examination (K-MMSE) scores (n = 12–13). Data are shown as mean ± SEM. *p < 0.05 versus CTL. The indicated p values represent a one-way ANOVA followed by Tukey’s post-hoc test. *p < 0.05, versus ND. †p < 0.05, versus HFD

