Fig. 7.
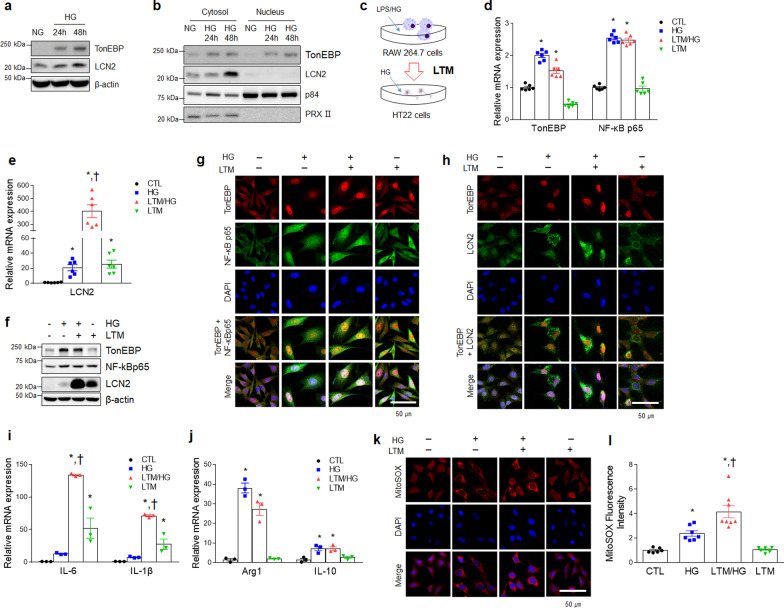
Expression of TonEBP and LCN2 in HG-treated HT22 cells is increased by LPS/HG-treated RAW 264.7 macrophage medium (LTM). a Western blot analysis of TonEBP and LCN2 in HT22 cells after HG treatment. b Western blot analysis of TonEBP and LCN2 in the cytosolic and nuclear fractions of HG-treated HT22 cells. p84 and PRXII are nuclear and cytosolic markers, respectively. c A schematic drawing of the LPS/HG-treated RAW 264.7 macrophage medium (LTM) treatment method in HG pre-treated HT22 cells. d, e Expression of mRNA encoding TonEBP (F = 124.9, p < 0.001) and NF-κBp65 (F = 204.9, p < 0.001) (d), LCN2 e (F = 59.14, p < 0.001) in HG, LTM/HG-treated HT22 cells was measured by quantitative RT-PCR (n = 6). f Western blot analysis of TonEBP, NF-κBp65, and LCN2 in LTM/HG-treated HT22 cell. g, h Representative immunofluorescence staining for NF-κBp65 and TonEBP (g) and LCN2 and TonEBP (h) in LTM/HG-treated HT22. DAPI was used for nuclear staining. i, j Expression of mRNA encoding IL-6 (F = 59.83, p < 0.001) and IL-1β (F = 58.6, p < 0.001) (i), Arg1 (F = 79.87, p < 0.001) and IL-10 (F = 10.29, p = 0.004) j in LTM/HG-treated HT22 cells was measured by quantitative RT-PCR (n = 3). k Detection of superoxide by MitoSOX™ Red in LTM/HG-treated HT22 cells. DAPI was used for nuclear staining. l Quantification of MitoSOX™ Red fluorescence intensity (F = 21.92, p < 0.001). Data are shown as mean ± SEM. The indicated p values represent a one-way ANOVA followed by Tukey’s post-hoc test. *p < 0.05 versus CTL, †p < 0.05 versus HG-treated HT22 cells

