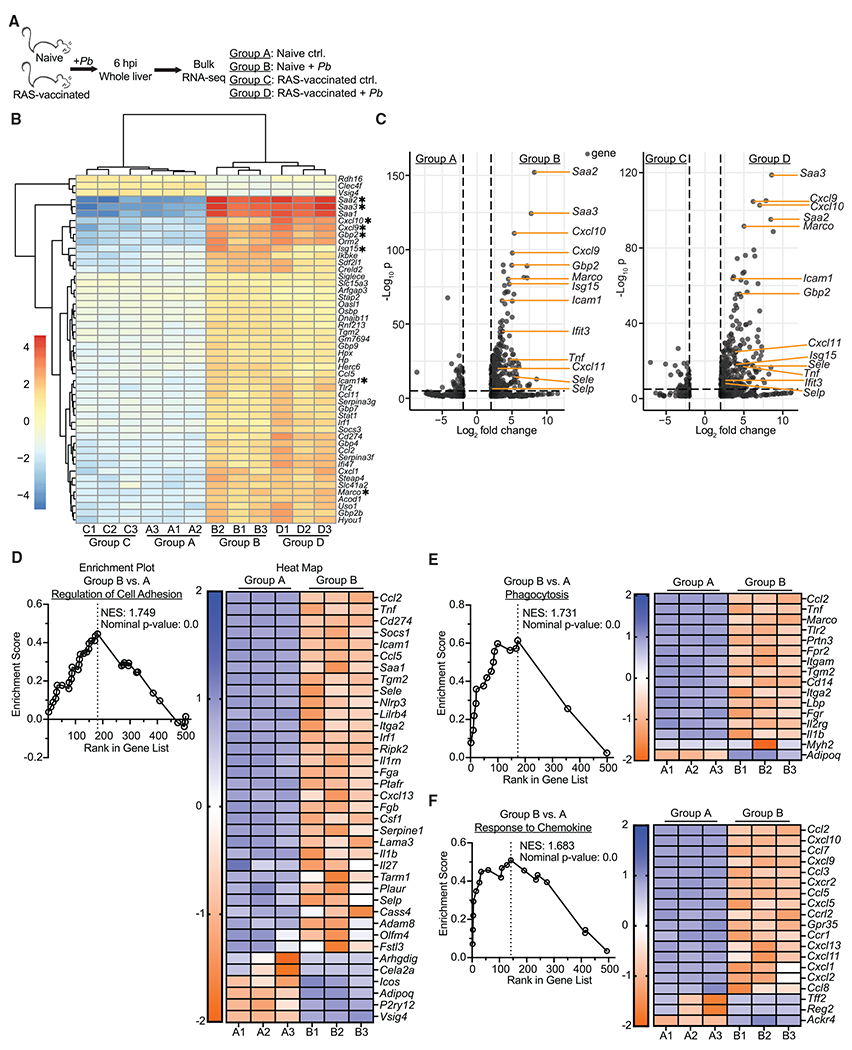
Figure 4. Liver-stage malaria infection rapidly triggers an inflammatory state in the liver.

(A) Experimental schematic. Age matched female naive and RAS-vaccinated (one dose of 104 RAS i.v. 28 days before sporozoite challenge) CB6F1 mice were unchallenged or received 3 × 10⁴ virulent Pb sporozoites. Livers were harvested at 6 hpi for RNA-seq.
(B) Heatmap displaying the top 60 differentially expressed genes (defined by adjusted p value) across the groups. Genes are sorted based on hierarchical clustering.
(C) Volcano plots comparing individual gene expression differences between various groups. Genes with a log2 fold change between −2 and 2 are excluded. Genes of particular interest are labeled. Dashed lines indicate thresholds of significance for log2 fold change (x axis, ±2) and adjusted p value (y axis, <0.05).
(D–F) Enrichment plots and associated heatmaps for gene pathways previously defined by the Gene Ontology database.
Data are from a single experiment with 3 biological replicates per group. Expression values were obtained via analysis with DESeq2, R, and edgeR. Thresholds for significance: log2 fold change >2 and <−2; normalized p value <0.05.
