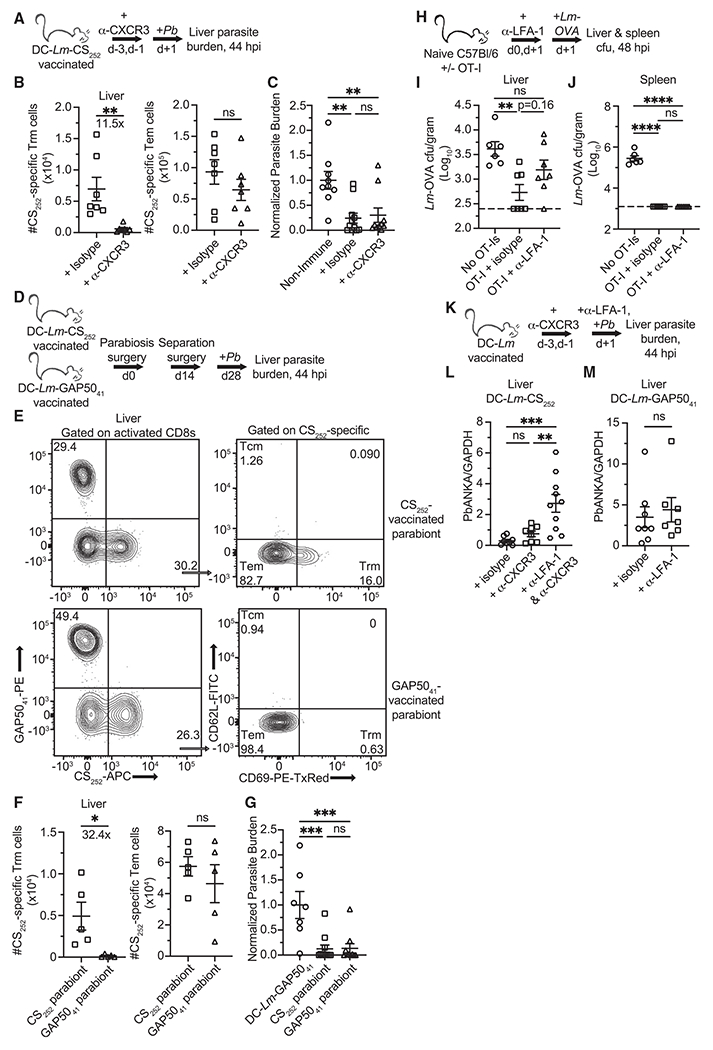
Figure 6. Tem cells mediate immunity to liver infection in a recruitment-dependent fashion.

(A, D, and K) Experimental schematics for protection against virulent Pb sporozoites. 104 live sporozoites were injected i.v. into mice. Liver parasite burden was measured 44 hpi.
(B) Quantification of liver localized CS252-specific liver Trm and Tem cells in DC-Lm-CS252-vaccinated mice 2 days after the 2nd α-CXCR3 dose.
(C) Normalized parasite burden showing degree of liver sporozoite infection 44 hpi in naive or isotype control and α-CXCR3-treated DC-Lm-CS252-vaccinated mice.
(E) Representative flow from separated parabiont mice demonstrating that antigen-specific circulating memory CD8 T cell populations equilibrate in the liver, whereas liver Trm compartments do not equilibrate. Top row: DC-Lm-CS252-vaccinated parabiont; bottom row: DC-Lm-GAP5041-vaccinated parabiont.
(F) Mice that received either DC-Lm-CS252 or DC-Lm-GAP5041 vaccinations were joined via parabiosis. Mice were surgically separated 14 days after parabiosis surgery. 14 days post separation, tissues were harvested for quantification of liver localized CS252-specific liver Trm and Tem cells.
(G) Normalized parasite burden showing degree of liver sporozoite infection 44 hpi in mice that were DC-Lm-GAP5041 immunized or CS252− and GAP5041−-vaccinated parabionts.
(H) Experimental schematic for protection against virulent Lm-OVA. 5 × 10⁵ OT-I Tem cells were isolated from the spleens of DC-Lm-OVA vaccinated C57BL/6 mice and adoptively transferred into naive recipient mice.
(I and J) Quantification of virulent Lm-OVA colony-forming unit (CFU) recovered from the livers and spleens of infected mice 48 hpi. Horizontal dashed lines indicate the limit of detection.
(L and M) Parasite burden showing degree of liver sporozoite infection 44 hpi in DC-Lm-CS252 and DC-Lm-GAP5041-vaccinated mice that were pre-treated with various antibodies.
All data are combined from 2 independent experiments, each with 2–5 mice per group. Symbols representing individual mice and mean ± SEM are depicted. (C, G, I, J, and L) One-way ANOVA (Tukey post hoc test) comparing the mean of each column to the mean of every other column was performed. (B, F, and M) Unpaired two-tailed t tests assuming similar SD were performed. *p ≤ 0.05, **p ≤ 0.01, ***p ≤ 0.001, ****p ≤ 0.0001; ns, p > 0.05.
