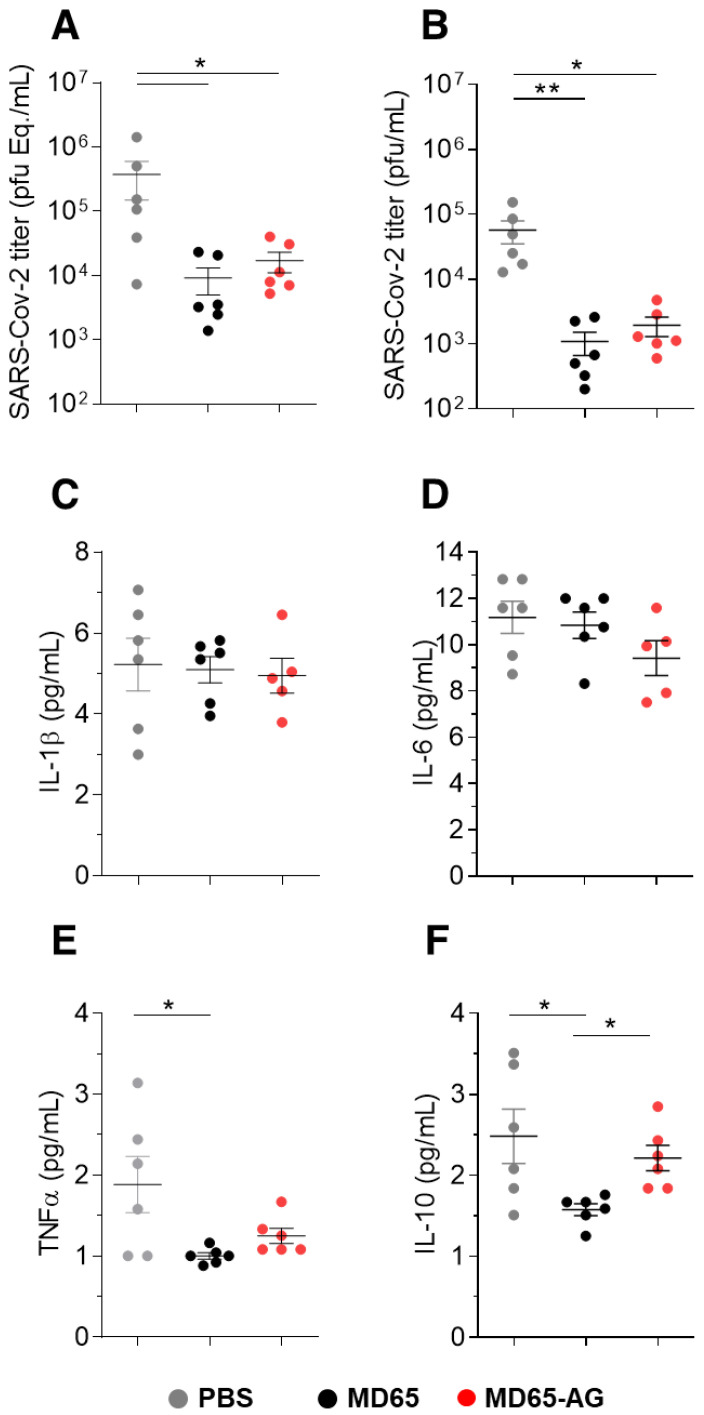
Figure 3.
Viral load and cytokine levels following prophylactic administration of MD65 mAb versions. Lung and sera samples were collected six dpi from infected mice treated with the indicated MD65 versions or with PBS as control (n = 6 for each group). (A) Viral load was quantified by qRT-PCR and expressed as equivalents of PFU/mL. (B) Infectious viral load determined by plaque assay. Cytokines levels in the sera were measured by multiplex kit (C) IL-1β, (D) IL-6, (E) TNFα and (F) IL-10. Data represent individual values and mean ± SEM. Horizontal bars indicate statistical significance between paired groups as determined by Kruskal–Wallis test (* p < 0.05, ** p < 0.01).

