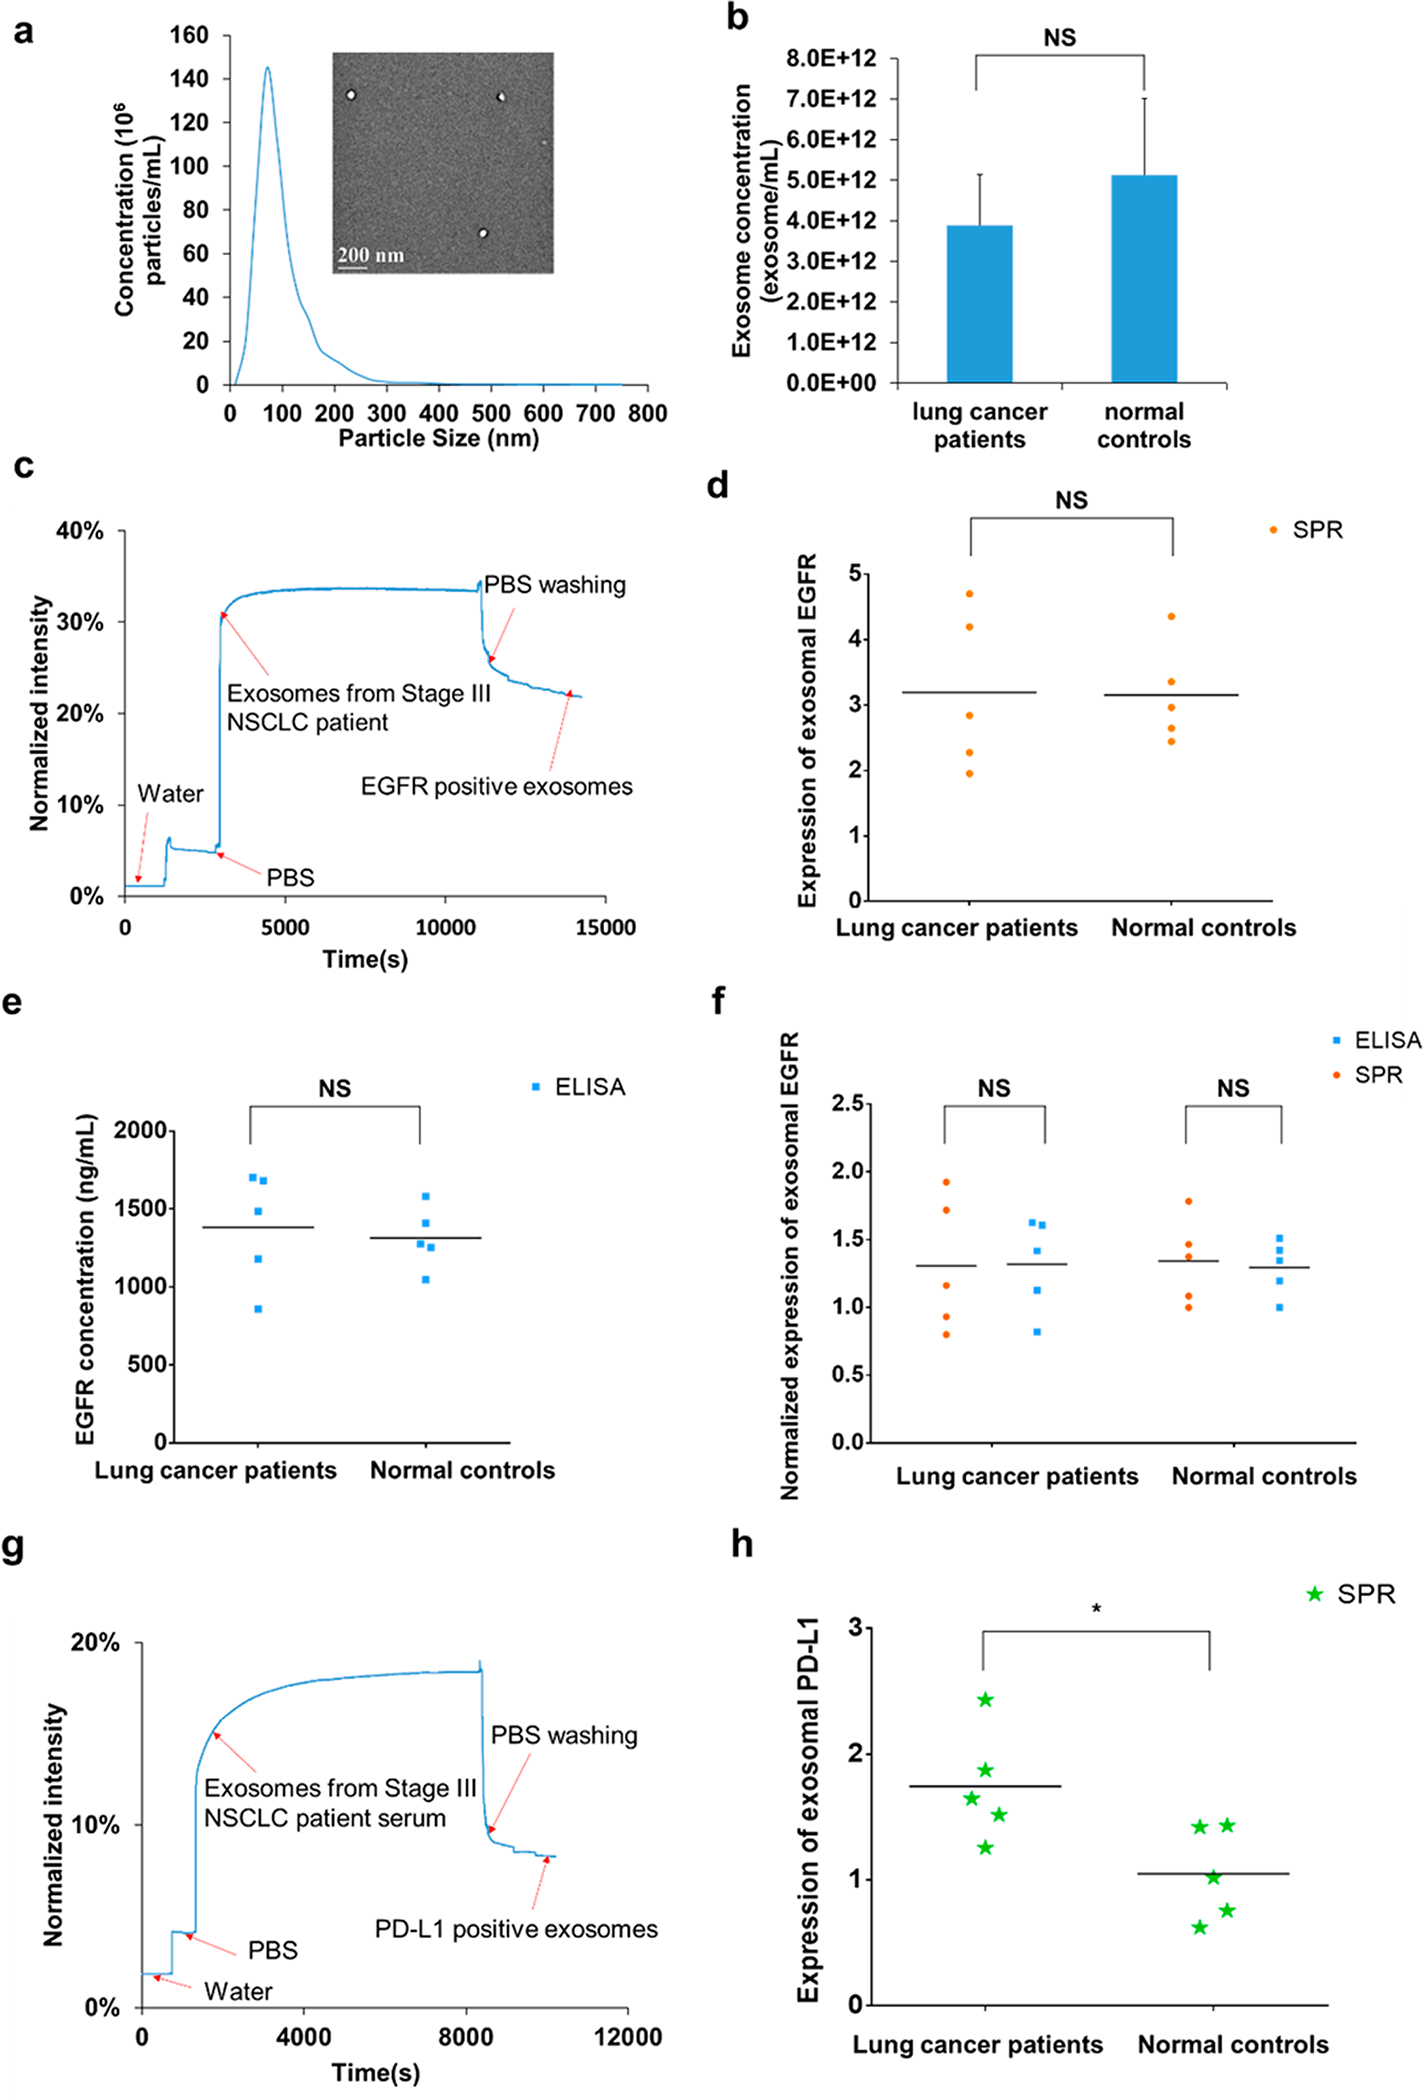
Figure 4.

(a) Representative size distribution of exosomes isolated from a serum sample (normal control #10) measured by NTA and the morphology of exosomes imaged by TEM (inset). (b) No significant difference was observed in the number concentrations of exosomes between lung cancer patients and normal controls. (c) Representative real-time response curve of compact SPR biosensor detecting exosomal EGFR in serum sample from a Stage III lung cancer patient. Expression of exosomal EGFR in serum samples measured by (d) compact SPR biosensor and (e) ELISA. (f) Compact SPR biosensor showed the same detection accuracy as ELISA in measuring exosomal EGFR levels in serum samples. To compare compact SPR biosensor with ELISA, all data were normalized to normal control #8. (g) Representative real-time response curve of compact SPR biosensor detecting exosomal PD-L1 in serum sample from a Stage III lung cancer patient. (h) Expression of exosomal PD-L1 in serum samples measured by compact SPR biosensor. ELISA was not able to detect exosomal PD-L1 levels in serum samples. (50 μL serum sample was used in all measurements. n = 5. *: p < 0.05. NS: no significant difference).
