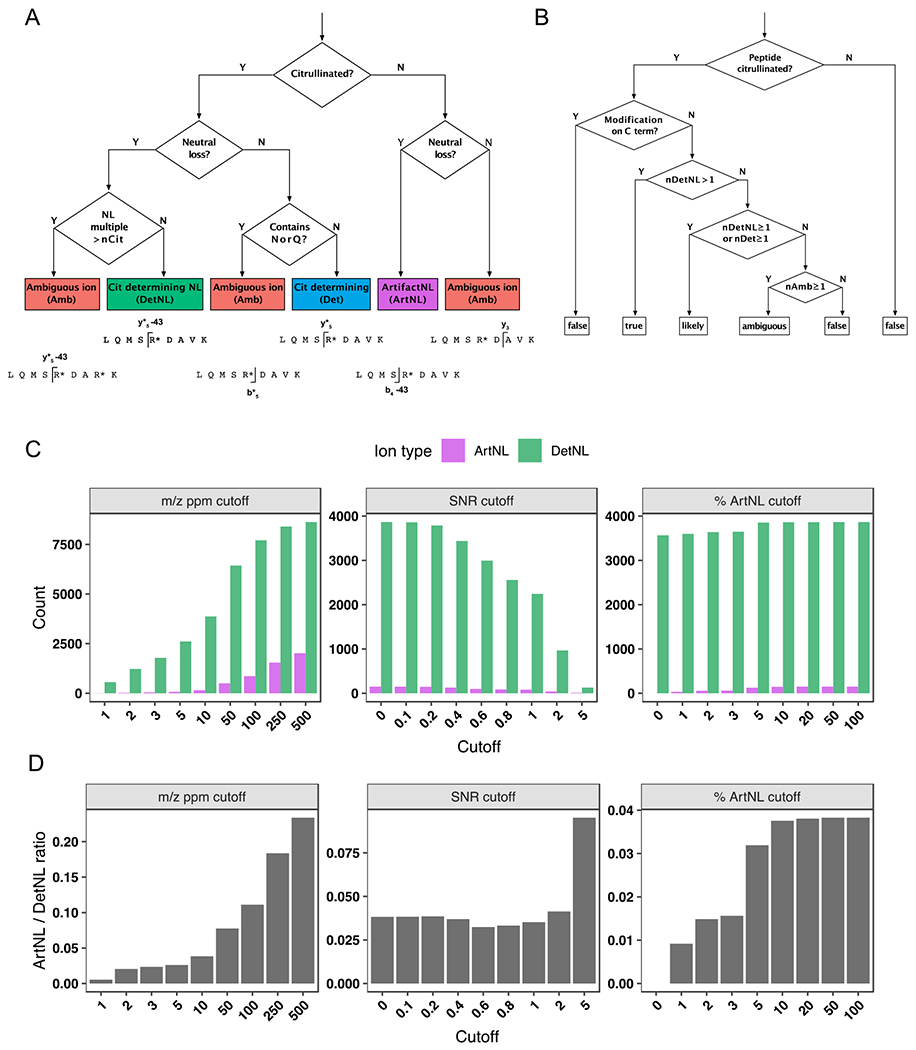
Figure 2. Decision trees and filtering criteria for ionFinder.

A) A decision tree depicting how each fragment ion within an MS/MS spectrum is binned into one of five categories: a citrulline-determining fragment (Det); (2) a citrulline-determining neutral loss fragment (DetNL); (3) an artifact neutral loss fragment (ArtNL); and, (4) an ambiguous fragment (Amb). B) A decision tree depicting how each PSM is assigned categories of “true”, “likely”, “ambiguous” and “false”, based on the number of DetNL, Det, and Amb fragments. C) Bar graphs depicting DetNL and ArtNL fragments upon varying the m/z ppm cutoff value (left panels), signal-to-noise cutoff (middle panels), and a dynamic % ArtNL cutoff (right panel). The data are depicted as total counts of fragments. D) Bar graphs depicting DetNL and ArtNL fragments upon varying the m/z ppm cutoff value (left panels), signal-to-noise cutoff (middle panels), and a dynamic % ArtNL cutoff (right panel). The data are depicted as ArtNL/DetNL ratios (bottom panels).
