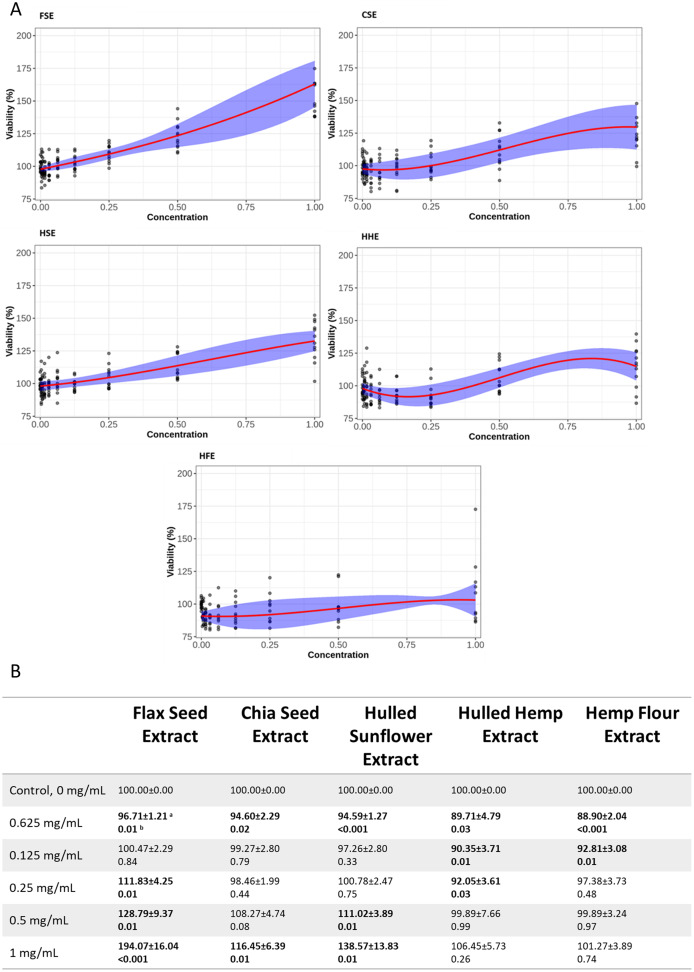
Figure 2. Viability of Caco-2 cells after treatment with flax, chia, sunflower, and hemp crude aqueous extracts.
(A) Plotted dose-response models. (B) Table of mean viability estimated from the dose-response model. Bold values are statistically significant when compared to the vehicle control (P < 0.05). aEstimated mean ± SEM, bP-value of model contrasts comparing viability in a treatment to the control. Purple ribbon represents standard error, red line is estimated mean.

