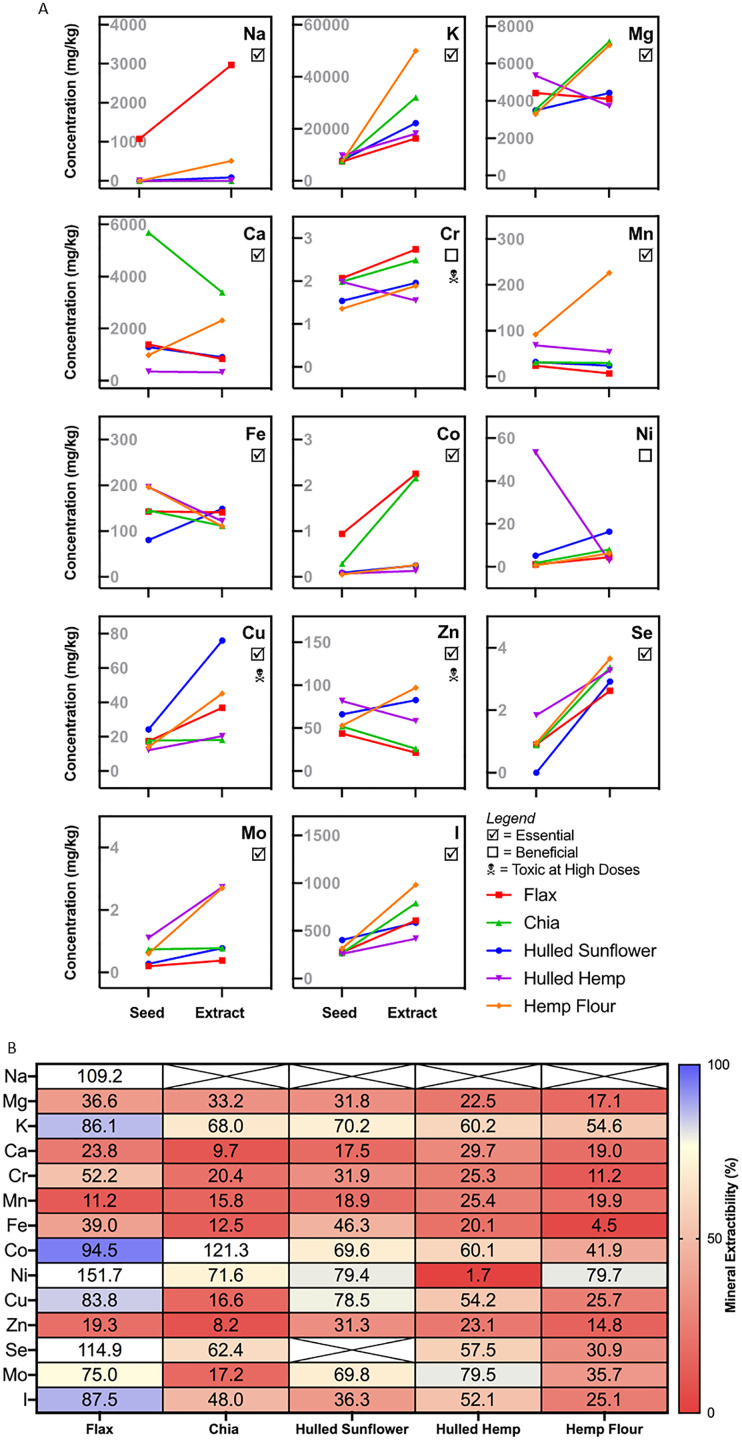
Figure 5. Mineral profiling comparing aqueous extracts to their source flour.
(A) Change in absolute mineral concentration from source flour to aqueous extracts. (B) Extractability of minerals from sunflower, flax, chia, and hemp seed flour represented as the percentage from whole seed found in the aqueous extracts. Crossed values are unable to be calculated due to zero values (below quantitation limit).

