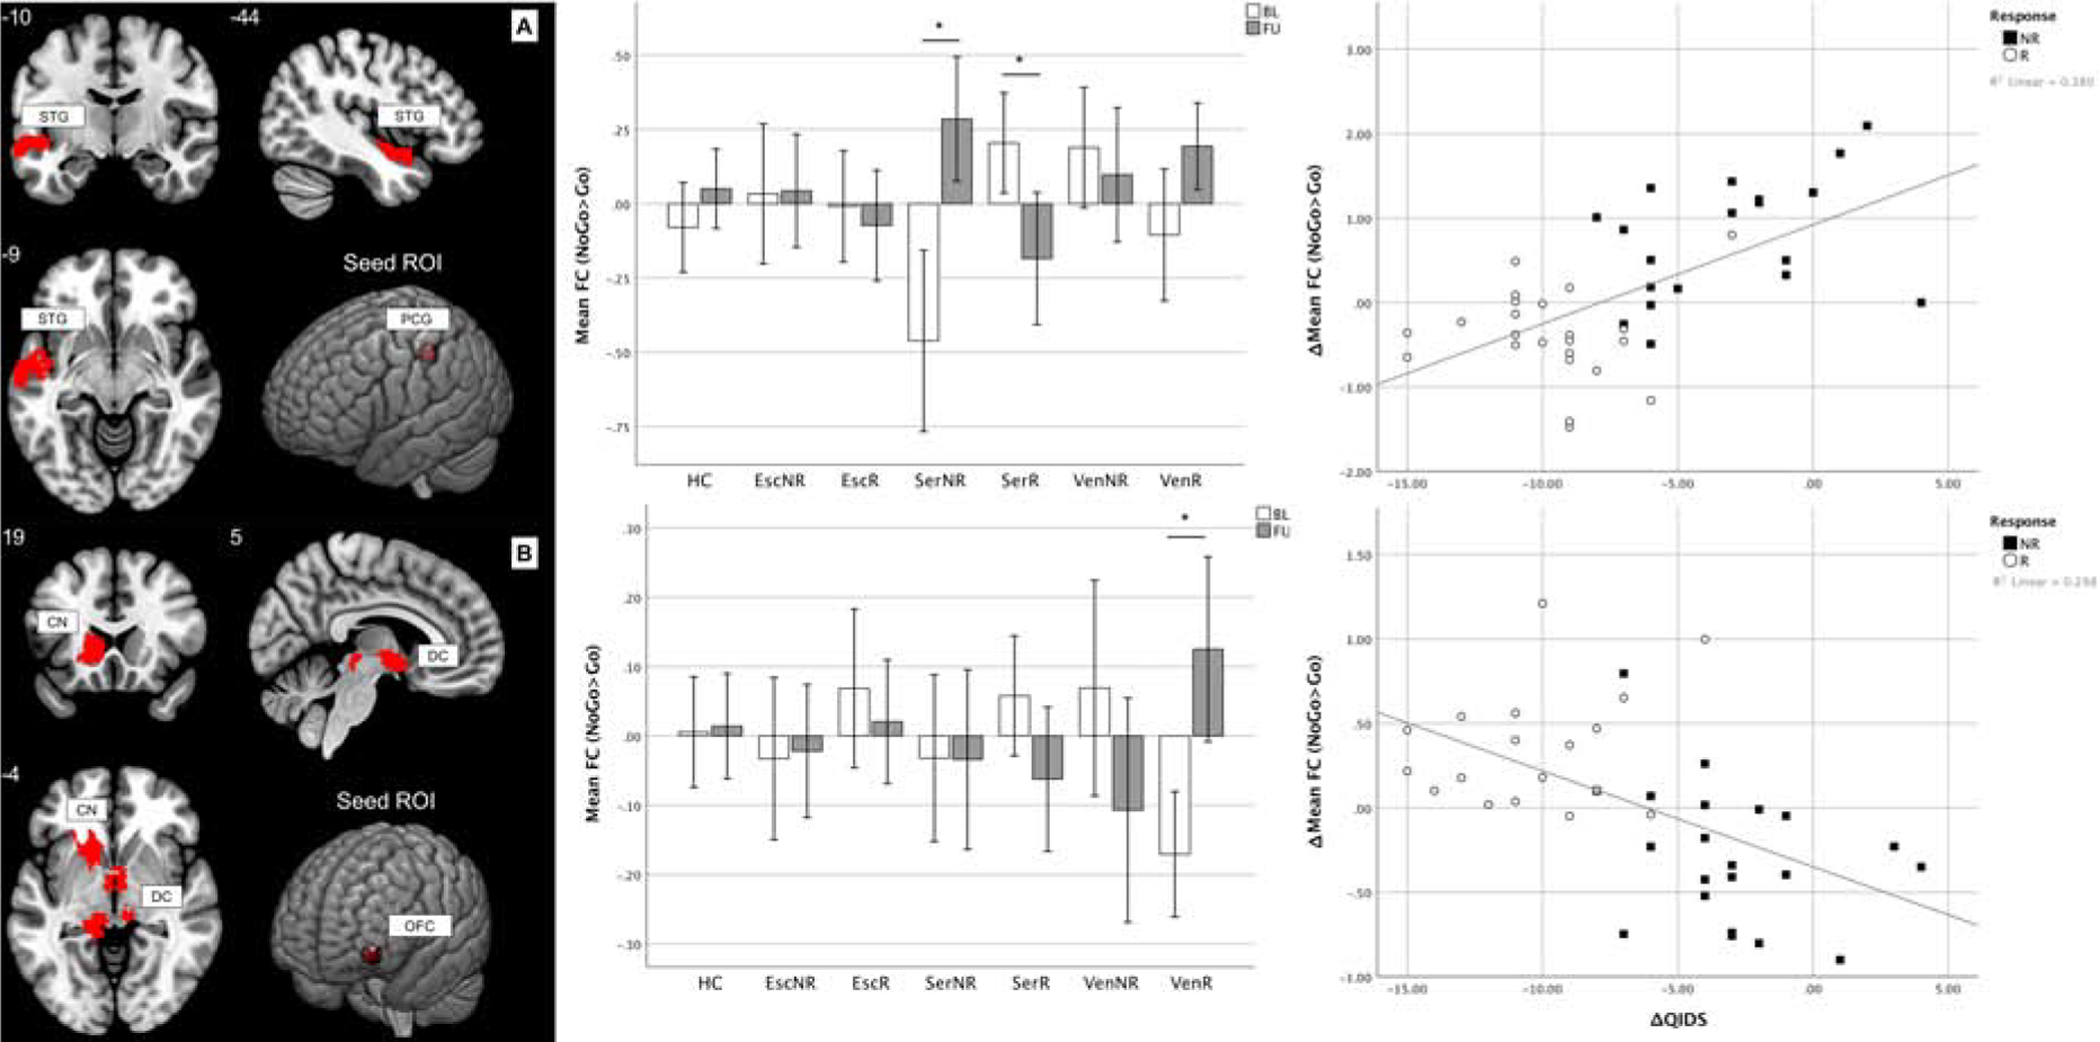
Figure 3: Functional connectivity correlates of antidepressant treatment response.

A: Participants responding to sertraline showed a decrease of FC between the left postcentral gyrus and left superior temporal gyrus (t=−3.476, p=0.002), whereas non-responders showed an increase (t=4.535, p<0.001). Also, changes in responders and non-responders were greater than the changes in HC (respectively t=−3.567, p=0.001 and t=3.066, p=0.004). Across all MDD participants, FC decrease was correlated with QIDS reduction after treatment (rho=0.588, p<0.001). B: MDD participants responding to venlafaxine-XR showed a decrease of FC between the left orbitofrontal cortex and the brainstem as well as caudate nucleus (t=3.853, p=0.001). Also, changes in responders were greater than the changes in HC (t=3.127, p=0.004). Across all MDD participants, FC decrease was correlated with QIDS reduction after treatment (rho=−0.658, p<0.001). Numbers indicate slice coordinates in MNI space. Stars mark significant comparisons (t-test p<0.05). For correlations, a linear fit line calculated based on the data is shown. ROI coordinates in MNI space: PCG=(−42 −30 46), OFC=(−40 54 −8). FC is expressed as difference of the parameter estimates of the hemodynamic response function (beta values) for the NoGo and Go conditions.
Abbreviations: BL=baseline, CN=caudate nucleus, DC=diencephalon, Esc=escitalopram, FC=functional connectivity, FU=follow-up, HC=healthy controls, MNI=Montreal neurological institute NR=non-responders, OFC=orbitofrontal cortex, PCG=postcentral gyrus, QIDS=Quick Inventory of Depressive Symptomatology scale, R=responders, ROI=region of interest, Ser=sertraline, STG=superior temporal gyrus, Ven=venlafaxine, Δ=difference between follow-up and baseline.
