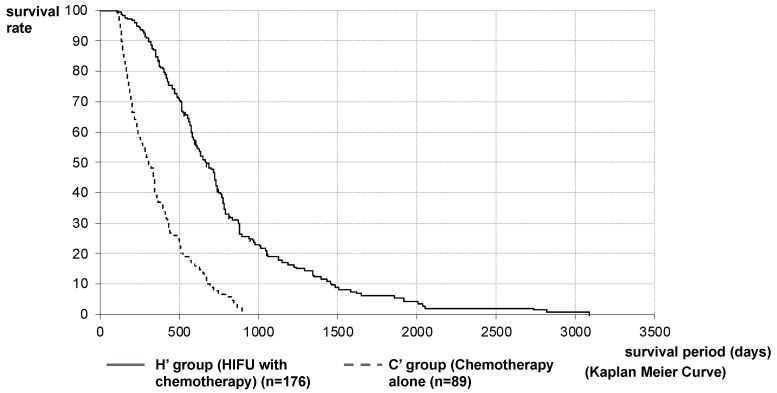
Figure 3.
Survival curve after diagnosis of PC in Stratified Analysis 1: stratified analysis matching the conditions with H and C Groups was performed on 176 patients in the H Group (H’ Group) and 89 patients in the C Group (C’ Group). MST after diagnosis of PC in the H ‘and C’ Groups were 648 vs. 310 days (21.3 vs. 10.2 months), respectively. The MST of the H’ Group was significantly longer than that of the C’ Group.

