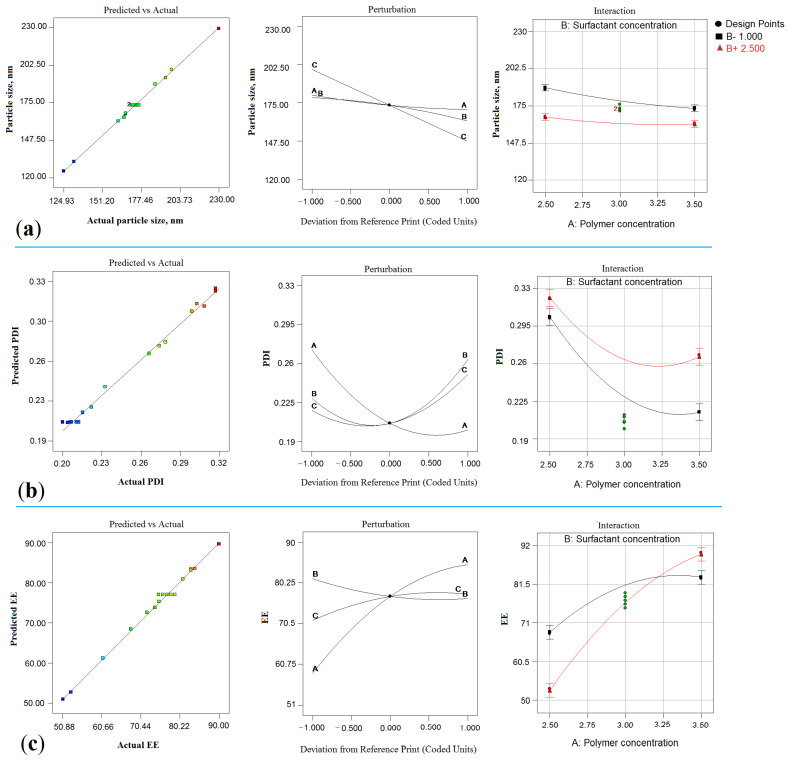
Figure 2.
Model diagnostic plot representing linear correlation plot between predicted vs. actual, perturbation chart and interaction plot for responses particle size, Y1 (a); entrapment efficiency, Y2 (b) and PDI, Y3 (c). (A = X1 = Polymer concentration; B = X2 = Surfactant concentration; and C = X3 = Sonication time).

