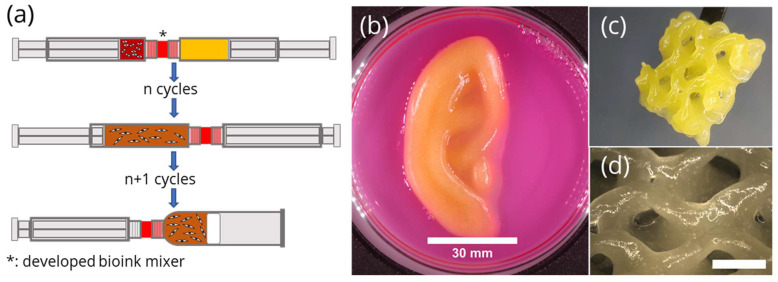
Figure 1.
(a) Schematic of the mixing process: cell suspension (left) and biomaterial ink (right) in separate syringes before mixing, after n mixing cycles and after n+1 mixing cycles (to transfer the bioink into a plotting cartridge); (b) 3D-plotted ear-like structure made from the plasma-alg-mc bioink model, scale bar 30 mm; (c,d) gyroid structure made from plasma-alg-mc bioink model, (d) scale bar: 5 mm.

