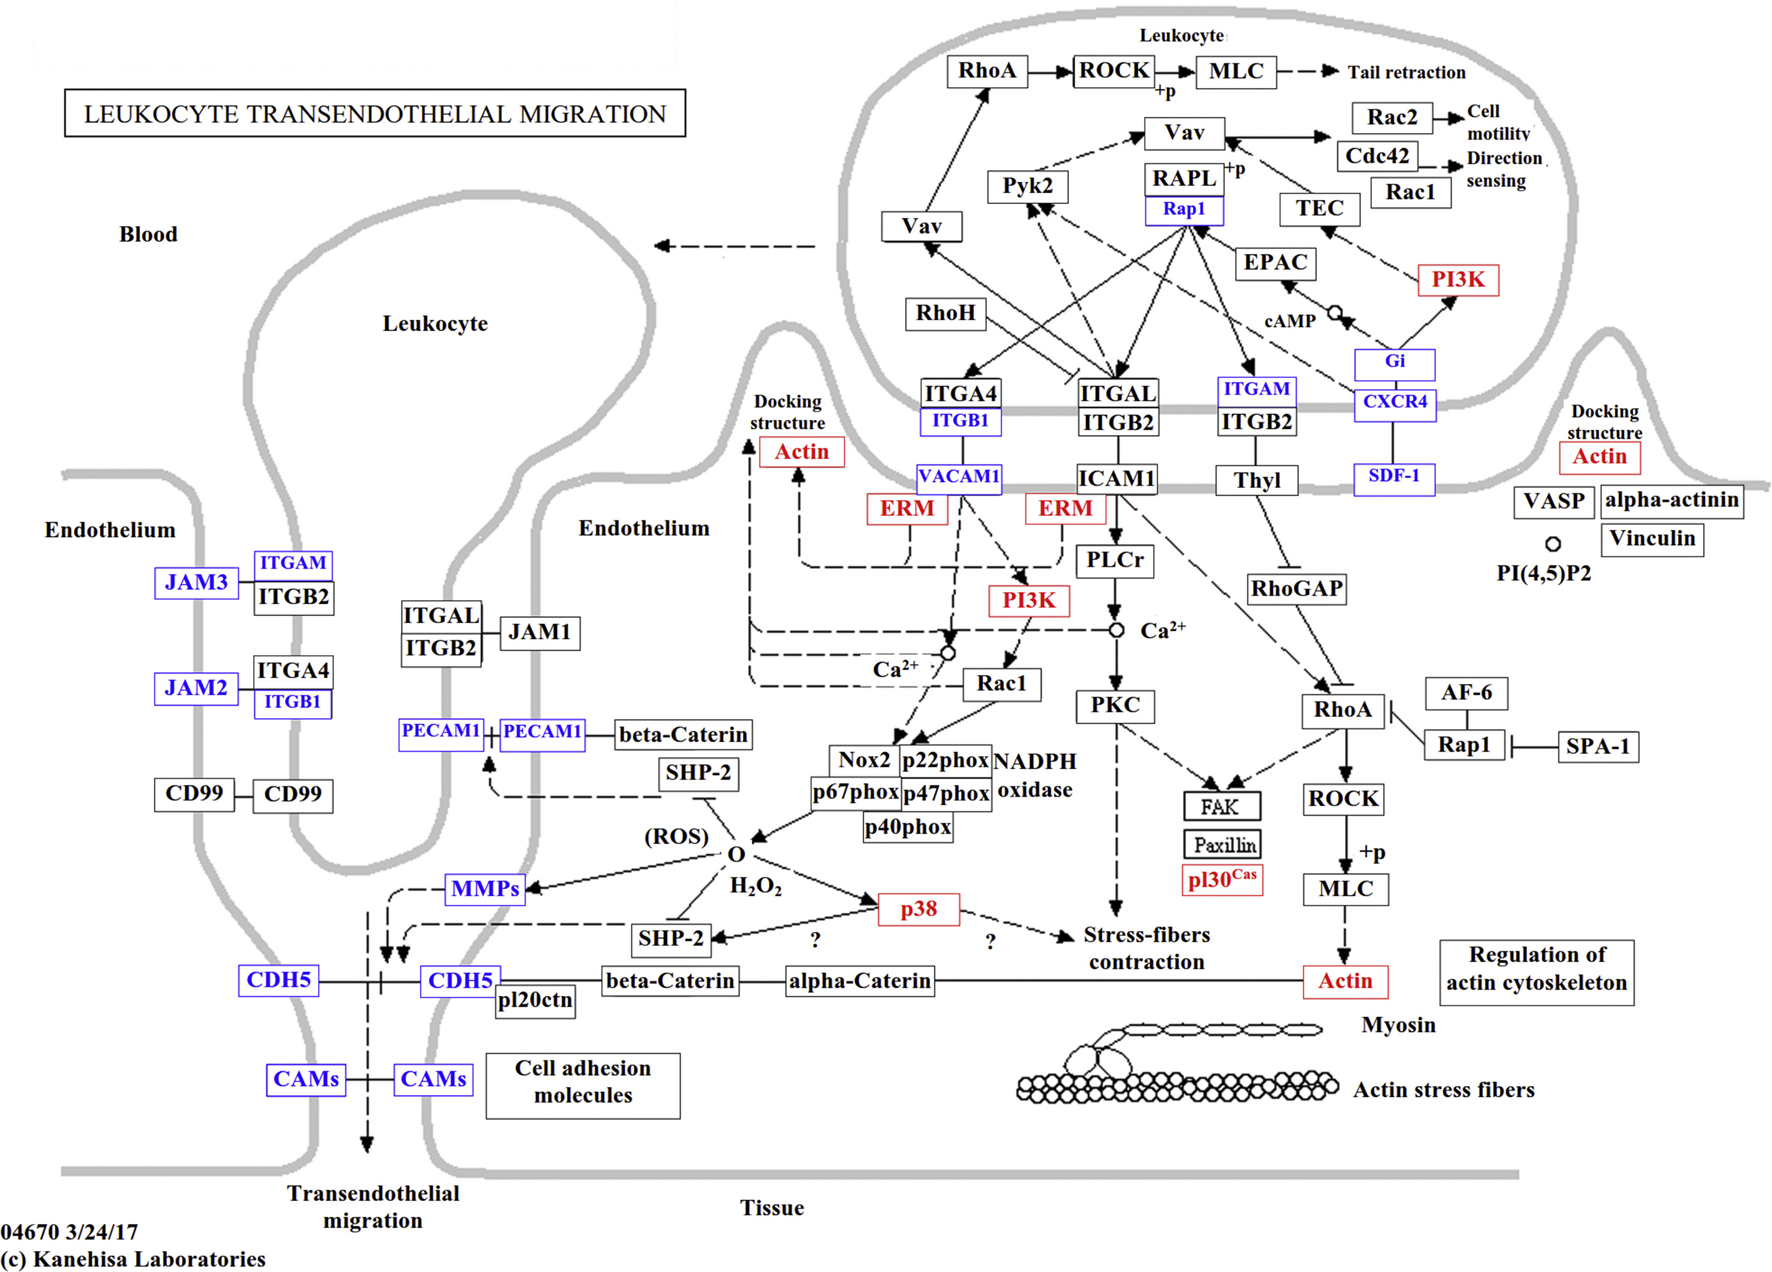
Fig. 4.

Distribution of DEGs in leukocyte transendothelial migration pathways. The nodes marked in red or blue represent genes which were up- or down-regulated, respectively, in the comparisons between the GNK vs. GF transcriptomes. Tissue samples were collected from GF (control group) and GNK (treated with 5% KCO plus 5 × 10⁸ CFU of B. xylanisolvens and E. coli) groups.
