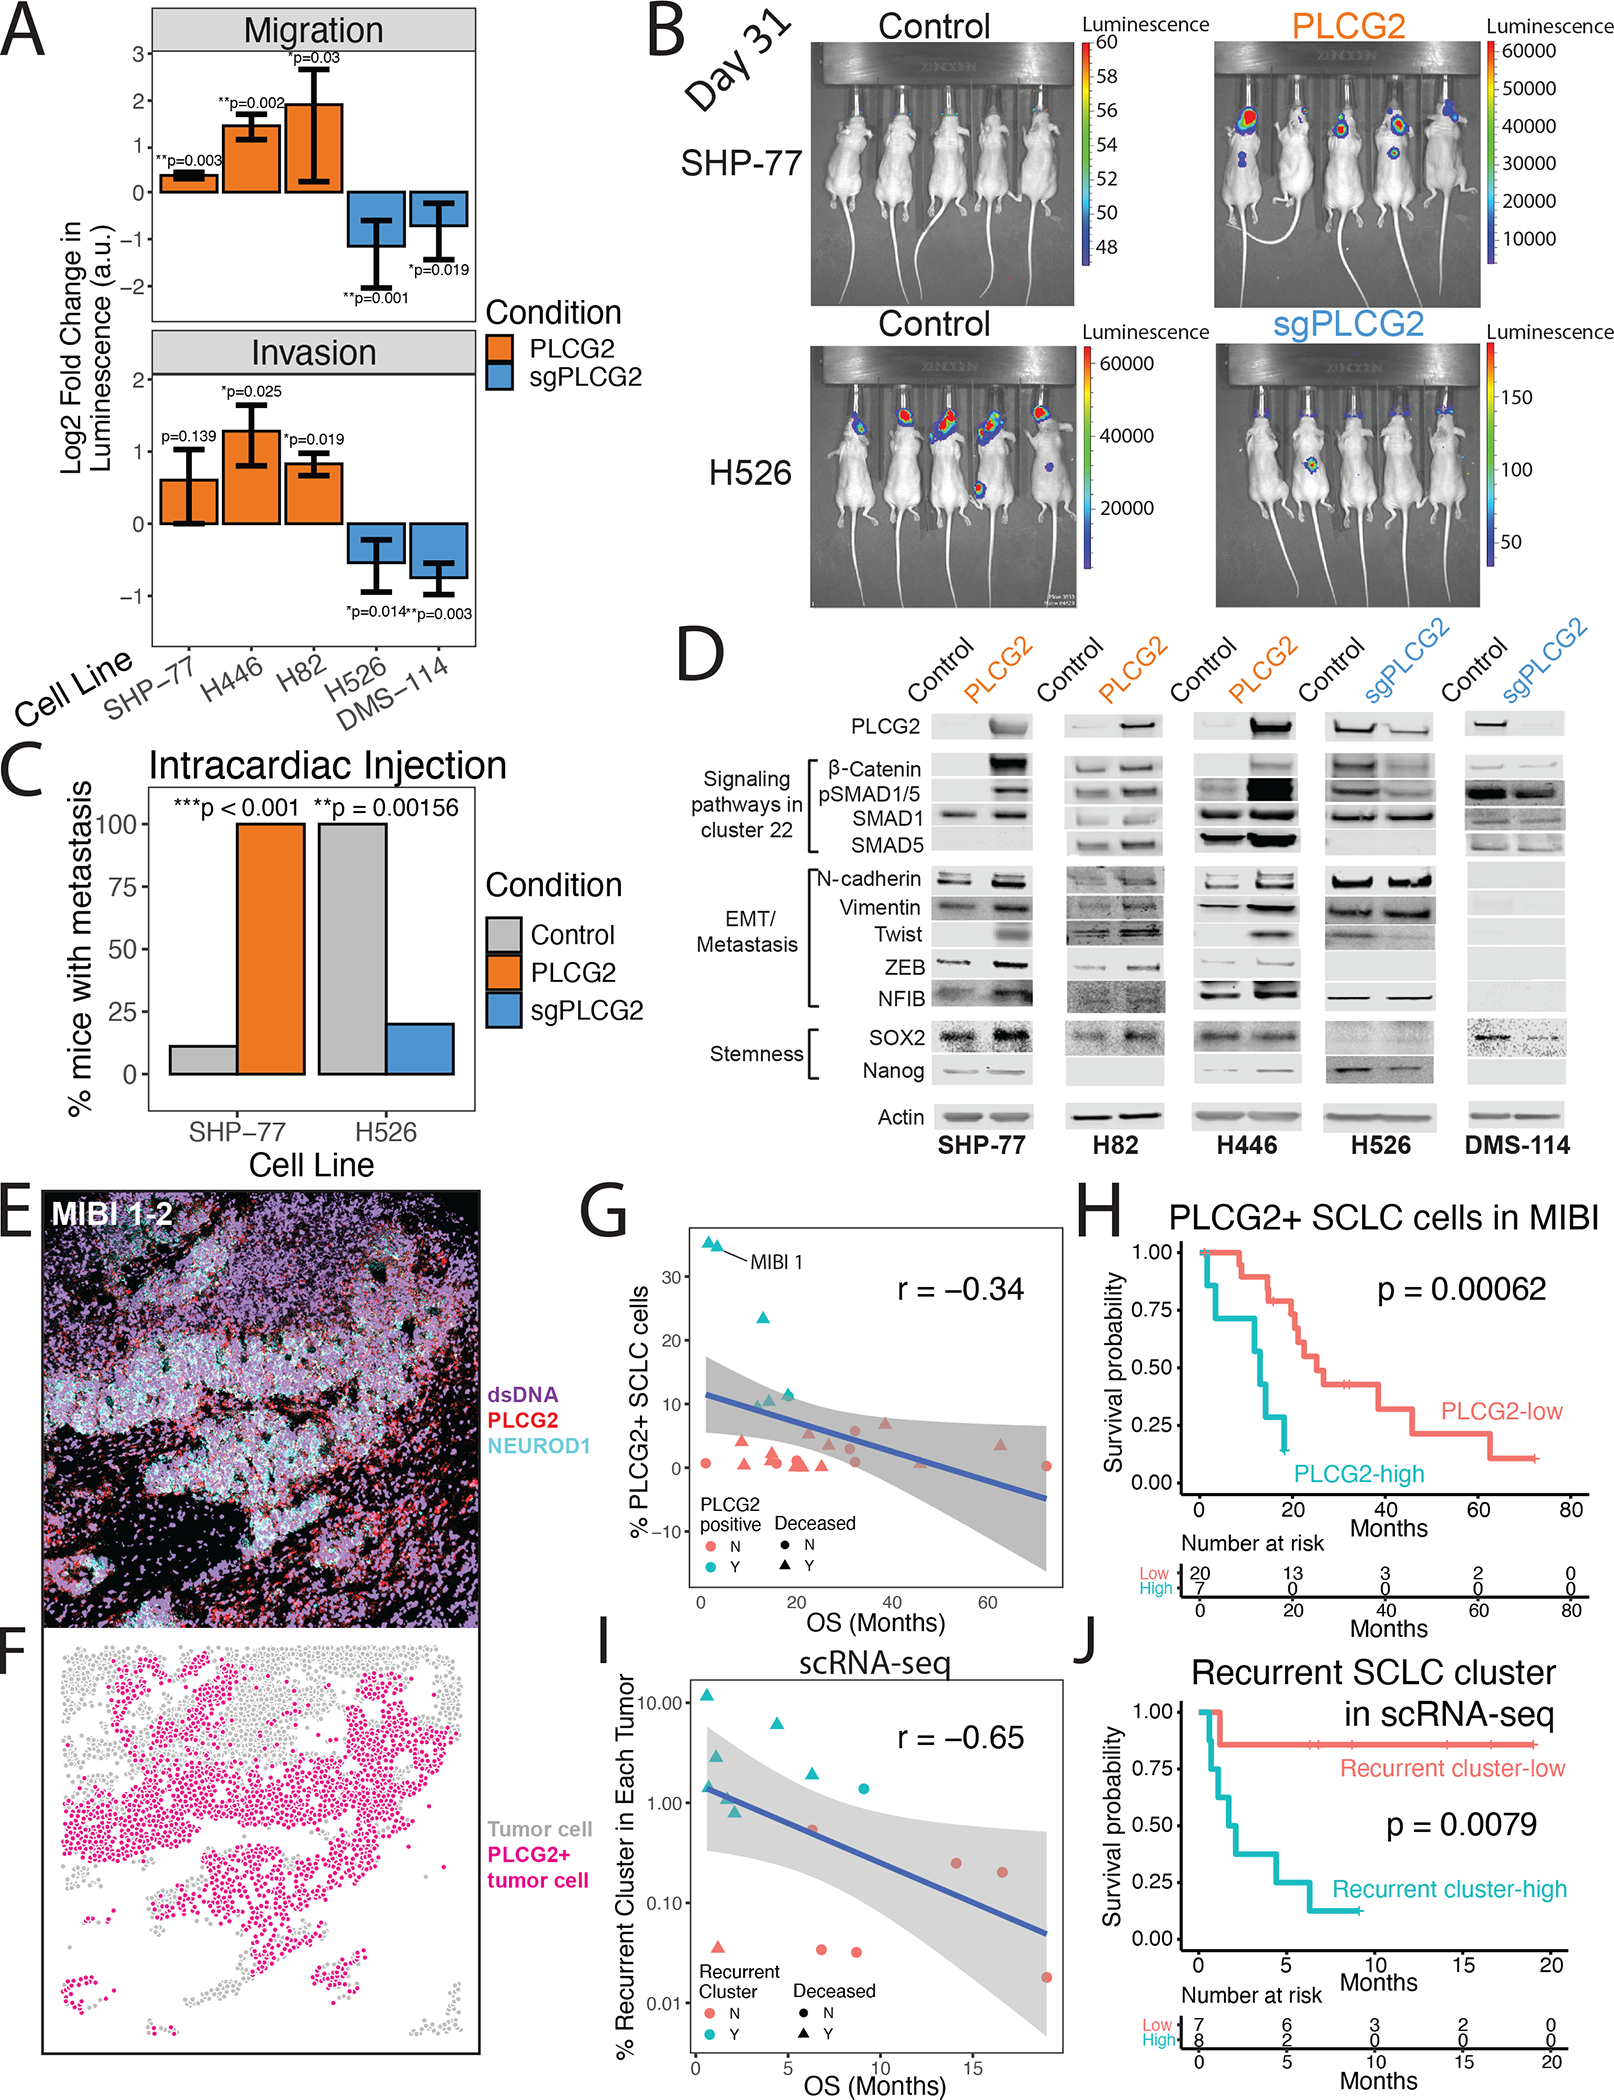
Figure 4: A role for the PLCG2+ recurrent cluster in metastasis and patient outcome associated with PLCG2 expression.

(A) Migration (top) and invasion (bottom) assays for PLCG2-overexpressing cell lines (SHP-77, H446, and H82) and PLCG2-CRISPR KO polyclonal (H526, DMS-114) cell lines, measured with a luminometric method in at least 3 independent experiments (3 technical replicates/experiment). Log2 fold change over control condition was calculated (two-tailed Student’s t-test; error bars: standard deviation).
(B) Luminescence imaging of mice at day 31 following intracardiac injection to assess metastatic capacity of PLCG2-overexpressing SHP77 cells and PLCG2-KO polyclonal H526 cells.
(C) Barplot showing the percentage of mice with metastasis in in vivo intracardiac injections of PLCG2-overexpressing SHP-77 and PLCG2-downregulated H526 cell lines in mice compared to control conditions (Fisher’s exact test).
(D) Western blots of markers associated with signaling pathways upregulated in cluster 22 (Wnt and BMP pathways), EMT/metastasis, and stemness in PLCG2-overexpressing and -KO polyclonal cell lines.
(E) Color overlay of PLCG2 (red), NEUROD1 (cyan), and dsDNA (violet) channels in SCLC tumor MIBI 1 from field of view (FoV) 2 (800 × 800 μm), illustrating high fraction of PLCG2-positive cancer cells. Error bars: 95% confidence interval.
(F) Same FoV as (E) now visualized based on segmented cancer cells using Mesmer (Greenwald et al., 2021), represented by dots colored by PLCG2 positivity. Error bars: 95% confidence interval.
(G) Scatterplot of the percent of PLCG2-positive SCLC cells per sample using MIBI-TOF vs overall survival (months) in an independent TMA cohort, annotated by percent of PLCG2+ SCLC cells >7% (cyan) and deceased patient (triangle). Spearman’s correlation r and example patient MIBI 1 from Figures 4E–F are shown.
(H) Kaplan-Meier analysis of OS in an independent cohort of SCLC patients (Table S14) with high vs low PLCG2 positivity (>7% vs ≤7% of SCLC cells with high PLCG2 staining intensity), as assessed by MIBI-TOF on a TMA. Note that the adjusted Cox proportional hazards model using the fraction of PLCG2-positive SCLC cells as a continuous rather than dichotomized covariate was also significantly predictive (p = 0.012, STAR methods).
(I) Scatterplot of the percent of the recurrent SCLC cluster per sample using scRNA-seq (log10 scale) vs overall survival (months), annotated by percent of recurrent cluster > 0.75% (cyan) and deceased patients (triangle). Spearman’s correlation r is indicated.
(J) Kaplan-Meier analysis of OS in patients with detectable PLCG2+ recurrent cluster cells by scRNA-seq (>0.75% vs ≤0.75% of SCLC cells) (Table S16). Note that the adjusted Cox proportional hazards model using the fraction of the recurrent cluster as a continuous rather than dichotomized covariate was also significantly predictive (p = 0.009, STAR methods). PLCG2 = PLCG2 overexpression, sgPLCG2 = CRISPR knockout. See also Figure S1 and Tables S1, S14, and S16.
