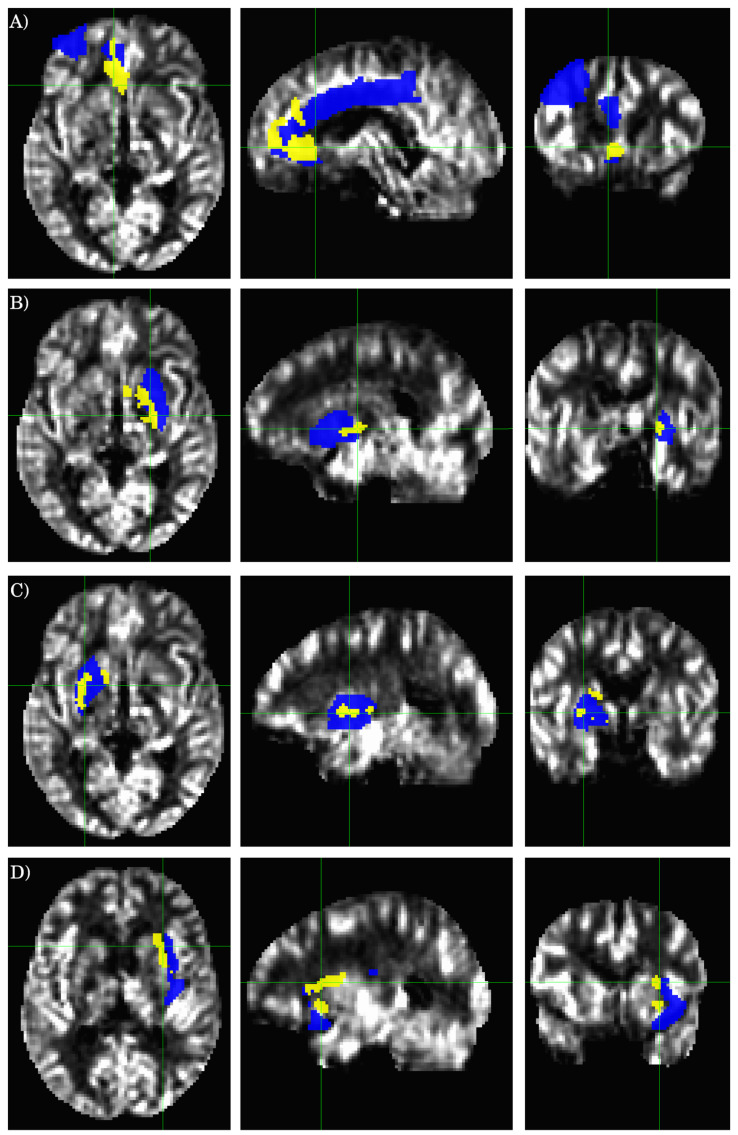
Figure 3.
Cross-sectional display of the relevant AAL ROIs and statistically significant clusters as detected by the voxel-wise two-sample t-test. The background image is the average rCBF result from the healthy controls. The yellow-colored regions show the clusters detected by the voxel-wise two-sample t-test, and the blue-colored regions depict the overlapping AAL ROIs. The crossing green lines indicate the locations of the cross-sections. (A–D) correspond to the ROIs 1-4 defined in Table 2, respectively.

