
Figure 5.
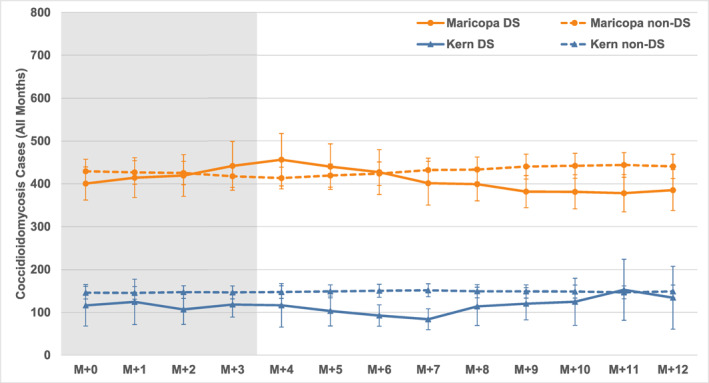
Composite coccidioidomycosis cases for 0‐ to 12‐month lags (M + 0 to M + 12) for all months with and without dust storms in Kern County, CA (Kern DS and Kern non‐DS) and Maricopa County, AZ (Maricopa DS and Maricopa non‐DS), 2006–2020. Dust storm occurrence/non‐occurrence is in month M + 0 on the left, and each line denotes the average case count in subsequent months from left to right. Vertical bars indicate 95% confidence intervals (t‐distribution). Lag months zero to three (M + 0 to M + 3), in which any dust storm‐related case increases should be apparent, are shaded in gray.