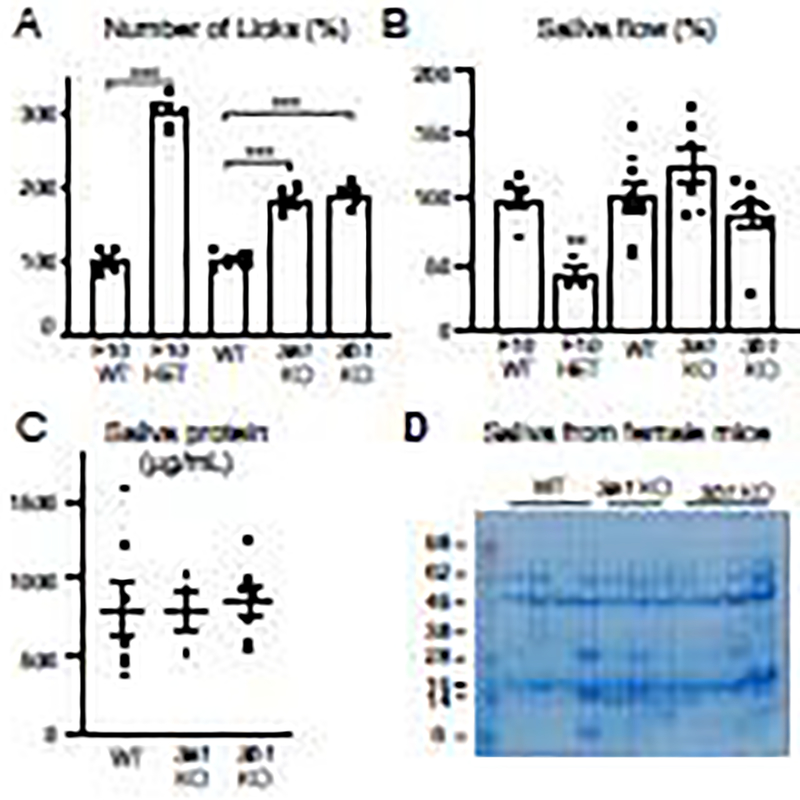
Figure 8. Hs3st3a1 and Hs3st3b1 KO mice drink significantly more water than the wildtype mice, but saliva flow and salivary proteins are not affected.
(A) Female adult mice were tested for 1 h using the Lickometer with free access to water and the number of licks are expressed as a percentage to their respective WT controls for each mouse strain. Data is presented as mean of four mice per groups that was tested 5 different times. Error bars: SD. One-way ANOVA compared to WT, * p < 0.05, ** p < 0.01, *** p < 0.001 and **** p < 0.0001. (B) Salivary flow rates in adult female mice were determined as described in Materials and Methods. Whole saliva was collected after pilocarpine stimulation. Saliva flow normalized to the WT and shown as %. Mean ± SEM. Dots represent saliva measurements of individual mice. Unpaired t-test for FGF10 HET, ** P < 0.01, as compared to FGF10 WT. One-way ANOVA for Hs3st3a1 KO and Hs3st3b1 KO compared to WT, not significant (C) Quantification of protein concentration in saliva from female mice assessed using BCA assay. Graph shows Mean ± SEM. Dots represent measurements of individual mice. No significant differences detected compared to WT littermates.

