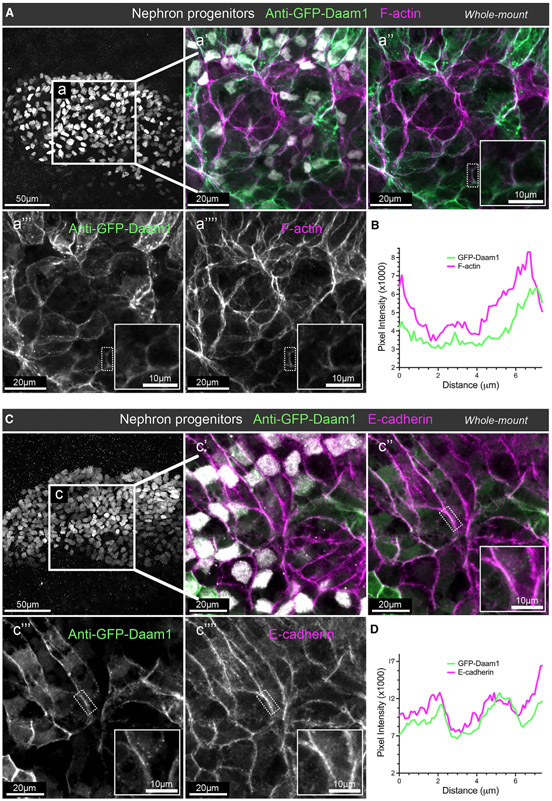
Figure 1. Daam1 co-localizes with junctional F-actin and E-cadherin during early nephron development.
(A) Confocal maximum image projections of whole-mount immunostaining of Xenopus nephric primordium labeled by Lhx1 (white) and GFP to visualize Daam1 (green) in conjunction with phalloidin staining to visualize F-actin (magenta); scale bar, 50 μm. a’–a”” are close-up images of region a; scale bars, 20 μm. The first panel consists of the entire z stack to show the cell positions within the entire kidney. In contrast, images displayed in a’–a”” contain a subset of the z slices to exclude the intense signal from phalloidin within the Xenopus skin. The white dotted box in a”–a”” marks the junction shown enlarged in the insets (scale bars, 10 mm) and analyzed in (B).
(B) A line plot showing the junctional intensity of F-actin (magenta) and GFP-Daam1 (green) of the junction highlighted in (A), a”–a””, by the white dotted box.
(C) Confocal maximum image projections of whole-mount immunostaining of Xenopus nephric primordium labeled by Lhx1 (white) and GFP to visualize Daam1 (green) in conjunction with E-cadherin (magenta); scale bar, 50 μm. c’–c”” are close-up images of region c; scale bars, 20 μm. The first panel consists of the entire z stack to show the cell positions within the entire kidney. In contrast, images displayed in c’–c”” contain a subset of the z slices to exclude the intense signal from E-cadherin within the Xenopus skin. The white dotted box in c”–c”” marks the junction shown enlarged in the insets (scale bars, 10 μm) and analyzed in (D).
(D) A line plot showing the junctional intensity of E-cadherin (magenta) and GFP-Daam1 (green) of the junction highlighted in c”–c”” by the white dotted box.

