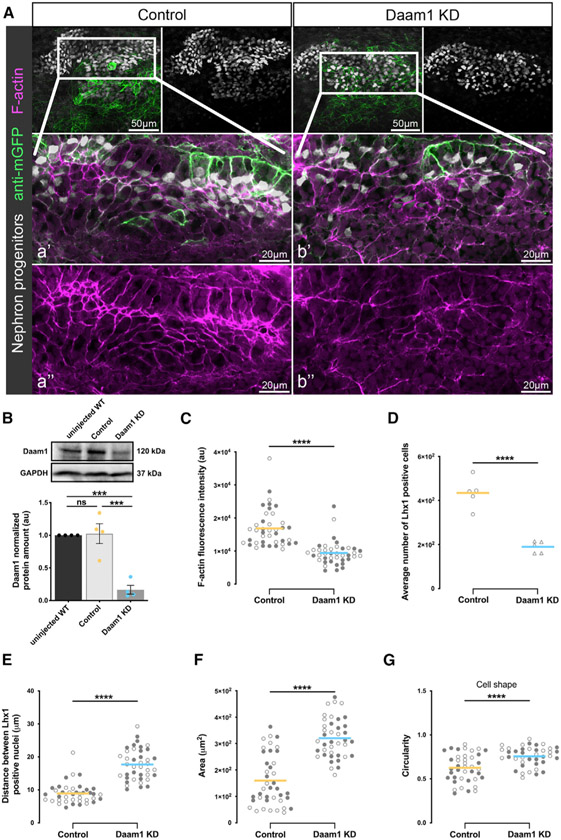
Figure 3. Effects of Daam1 depletion on the nephrogenic primordium.
Kidney-targeted microinjections using control or Daam1 MO combined with the membrane-GFP mRNA (used as a lineage tracer) were carried out to analyze the effect of Daam1 depletion on Xenopus developing kidney.
(A) Maximum-projection confocal images of control or Daam1 KD embryos stained whole mount with antibodies against GFP (to detect the membrane-GFP tracer, green) and Lhx1 (to label nephric progenitors, white), in conjunction with phalloidin (to visualize F-actin, magenta). The top panels consist of the entire z stacks to show the cell positions within the entire kidney; scale bars, 50 μm. a’–a” and b’–b” are close-up images of the corresponding regions in white boxes consisting of a subset of the z slices to exclude the intense F-actin signal within the Xenopus skin; scale bars, 20 μm. The “seam” of enriched actin in the nephron center corresponds to the region where the lumen will form; see Videos S3 and S4.
(B) Western blot and graph of densitometry measures showing Daam1 and GAPDH protein levels for uninjected wild-type (WT), control (standard MO)-injected, and Daam1 KD (Daam1 MO)-injected embryos. Embryo lysates were pooled from 10–20 V2-cell injected embryos at stages NF 28–32, and approximately 1/2 embryo was loaded per lane. Individual band intensities are normalized to the uninjected band and plotted in arbitrary units (a.u.) for uninjected (black), control (orange), and Daam1 KD (blue). The results are expressed as means ± SEM from four independent experiments. nsp > 0.05, ***p ≤ 0.001, analyzed by one-way ANOVA.
(C) The graph showing the mean relative fluorescence intensity levels in a.u. of junctional F-actin in the nephric primordia of control (orange) and Daam1 KD (blue) embryos. ncontrol = 40 junctions and nDaam1 KD = 40 junctions on 2 embryos, denoted by open and closed circles, respectively. ****p ≤ 0.0001, analyzed by unpaired t test.
(D–G) Morphometric analyses of control and Daam1-depleted nephric primordia. The thick bars represent the mean for control (orange) and Daam1-depleted (blue) embryos. ****p ≤ 0.0001, analyzed by unpaired t test. Graphs show comparison of control and Daam1-depleted nephric primordia of (D) the average number of Lhx1-positive nephron progenitors, where ncontrol = 5 embryos and nDaam1KD = 5 embryos; (E) the relative distance between nearest neighbors of Lhx1-positive nuclei; (F) the relative cell area; and (G) the relative circularity, where 1 represents a perfect circle.
(E–G) ncontrol = 40 junctions on 2 embryos and nDaam1 KD = 40 junctions on 2 embryos, denoted by open and closed circles, respectively.

