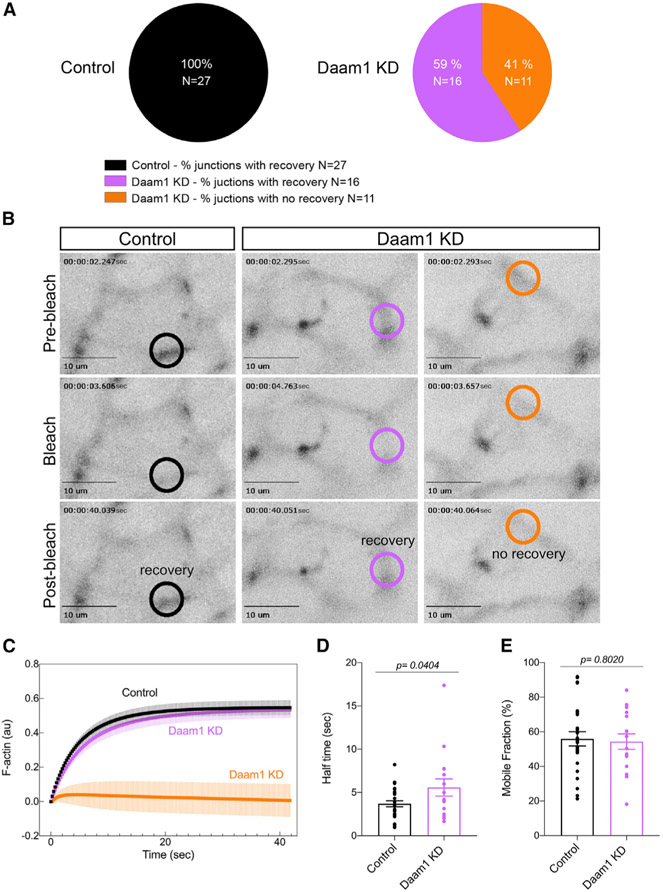
Figure 4. Daam1 regulates assembly of junctional F-actin in developing nephrons.
F-actin dynamics at cell junctions of control and Daam1 KD developing nephrons expressing mCherry-Utrophin were assessed using FRAP. (A–E) Control (black, ntotal = 27 junctions, 1–5 junctions/embryo) and Daam1 KD (purple, 16 junctions; orange, 11 junctions; ntotal = 27 junctions, 1–5 junctions/embryo).
(A) Percentage of junctions showing recovery of fluorescence after bleaching in control and Daam1 KD nephrons.
(B) Typical time-lapse images of control and Daam1 KD cell junctions before and after photobleaching. In each image, the bleached region is highlighted with a circle (black, control junction showing recovery; purple, Daam1 KD junction showing recovery; orange, Daam1 KD junction showing no recovery of fluorescence after photobleaching). Scale bars, 10 μm.
(C) Graph showing average recovery curves in a.u. obtained from individual best-fit plots for control (black) and Daam1 KD junctions with (purple) and without (orange) recovery of fluorescence after photobleaching.
(D and E) Bar graphs comparing control and Daam1 KD profiles calculated from individual best-fit curves for control (black) and Daam1 KD junctions with recovery of fluorescence after photobleaching (purple). The dots represent analyzed junctions. Data represent the mean ± SEM from three independent experiments. The p values were analyzed by unpaired t test.
(D) Bar graph of the relative half-times for F-actin.
(E) Bar graph of the relative mobile fraction for F-actin.

