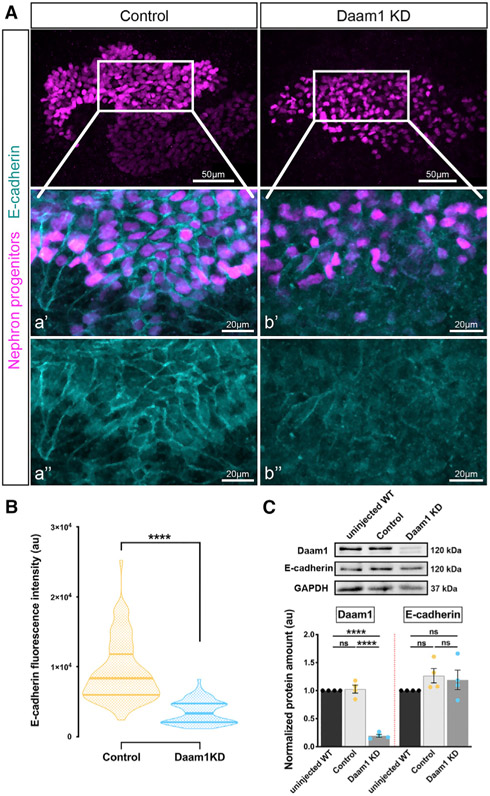
Figure 5. Daam1 promotes localization of junctional E-cadherin.
(A) Maximum-projection confocal images of whole-mount immunostaining of Xenopus nephric primordium labeled by Lhx1 (magenta) and E-cadherin (cyan) in control and Daam1 KD embryos; scale bars, 50 μm. a’–a” and b’–b” are close-up images of the corresponding regions in the white boxes; scale bars, 20 μm. The top panels consist of the entire z stacks to show nephric progenitors’ cell positions within the developing kidney. In contrast, images displayed in a’–a” and b’–b” contain a subset of the z slices to exclude the intense signal from E-cadherin expressed in the epithelium of the Xenopus skin. a’–b’, nephric cell progenitors labeled by Lhx1 (magenta) and E-cadherin (cyan); a”–b”, E-cadherin (cyan).
(B) Violin plots depicting the relative fluorescence intensity in a.u. of junctional E-cadherin in the nephric primordia of control (orange) and Daam1 KD (blue). ncontrol = 88 junctions on 4 embryos and nDaam1 KD = 84 junctions on 4 embryos. Centerlines represents the median; limits show the first and third quartiles. ****p ≤ 0.0001, analyzed by unpaired t test.
(C) Western blot and graph of densitometry measures in a.u. showing Daam1, E-cadherin, and GAPDH protein levels in uninjected WT, control (standard MO)-injected, and Daam1 KD (Daam1 MO)-injected embryos. Embryo lysates were pooled from 10–20 1-cell injected embryos at stages NF 11–12, and approximately 1/2 embryo was loaded per lane. Individual band intensities are normalized to the uninjected band and plotted in a.u. for uninjected (black), control (orange), and Daam1 KD (blue). The results are expressed as means ± SEM from four independent experiments. nsp > 0.05, ****p ≤ 0.0001, analyzed by one-way ANOVA.

