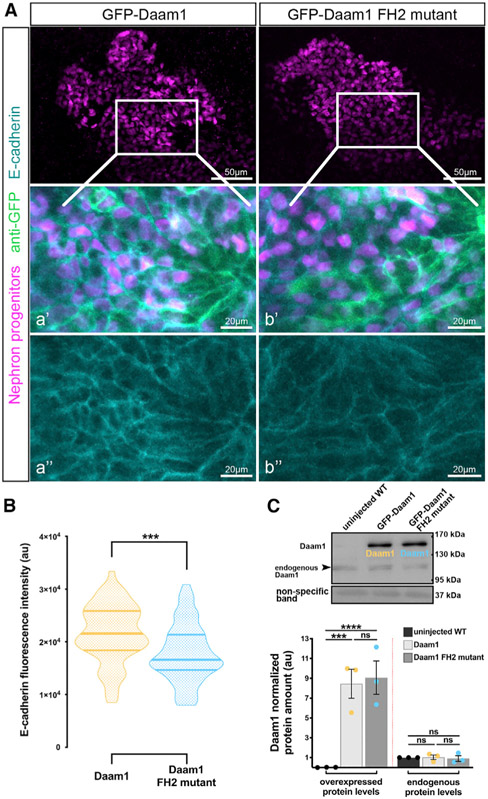
Figure 6. The FH2 domain of Daam1 mediates E-cadherin localization to cell junctions.
(A) Maximum-projection confocal images of whole-mount immunostaining showing E-cadherin (cyan) in Xenopus nephric primordium labeled by Lhx1 (magenta) expressing GFP-Daam1 or GFP-Daam1 FH2 mutant mRNA (labeled by anti-GFP, green); scale bars, 50 μm. a’–a” and b’–b” are close-up images of the corresponding regions in the white boxes; scale bars, 20 μm. The top panels consist of the entire z stacks to show nephric progenitors’ cell positions within the developing kidney. In contrast, images displayed in a–a’ and b–b’ contain a subset of the z slices to exclude the intense signal from E-cadherin expressed in the epithelium of the Xenopus skin. a’–b’, nephric cell progenitors labeled by Lhx1 (magenta), anti-GFP (green), and E-cadherin (cyan); a”–b”, E-cadherin (cyan).
(B) Violin plots depicting the relative fluorescence intensity of junctional E-cadherin in nephric primordia expressing GFP-Daam1 (orange) and GFP-Daam1 FH2 mutant (blue) mRNA. nDaam1 = 60 junctions on 3 embryos and nDaam1FH2mutant = 55 junctions on 3 embryos. Centerlines show the median; limits show the first and third quartiles. ***p ≤ 0.001, analyzed by unpaired t test.
(C) Western blot and the graph of densitometry measures showing the exogenous and endogenous protein levels of Daam1 in uninjected WT embryos and embryos injected with 1 ng Daam1 or Daam1 FH2 mutant mRNA. The non-specific band confirms equal loading. Embryo lysates were pooled from 10–20 1-cell injected embryos at stages NF 11–12, and approximately 1/2 embryo per lane. The results are expressed as means ± SEM from three independent experiments. Individual band intensities are normalized to the uninjected band and plotted in a.u. for uninjected (black), Daam1 (orange), and Daam1 FH2 mutant (blue). nsp > 0.05, ***p ≤ 0.001, ****p ≤ 0.0001, analyzed by one-way ANOVA.

