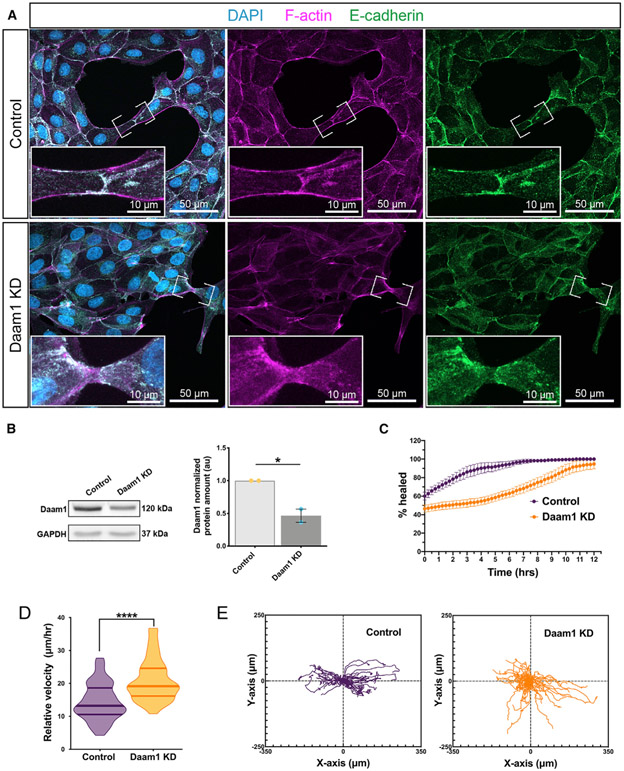
Figure 7. Daam1-depleted MDCK cells display compromised localization of E-cadherin at cell-cell contacts and impaired cohesion during collective movement.
(A) Maximum-projection confocal images of E-cadherin (green), F-actin (magenta), and DAPI (cyan) in subconfluent MDCK control and shDaam1 KD cells. The first column shows merged images of individual color channels. Images of individual color channels for F-actin and E-cadherin are shown in the second and third columns, respectively. Scale bars, 50 μm. E-cadherin localization in nascent cell-cell contacts (marked by white brackets and shown enlarged in the corresponding white boxes; scale bars, 10 μm) is impaired in shDaam1 KD cells.
(B) Western blot showing Daam1 and GAPDH protein levels in MDCK control and shDaam1 KD cells. Individual band intensities are normalized to the control band and plotted in a.u. for control (orange) and Daam1 KD (blue). The graph of densitometry measures represents the means ± SEM of two independent experiments. *p ≤ 0.05, analyzed by unpaired t test.
(C–F) Summary of the wound healing experiments for MDCK control and Daam1 KD cells; see Video S7.
(C) Daam1 depletion impairs wound closure. The graph represents the percentage of the wound surface area over time for control (purple) and Daam1 KD (orange) cells. Error bars indicate SE of the mean of 4 assays.
(D–F) Manually tracking single cells’ migration paths during wound closure demonstrates that Daam1 organizes collective movement of MDCK epithelial monolayers by modulating the speed and directionality of individual cells. Daam1 results in increased velocity and random migration. ncontrol = 52 cells from 4 assays and nDaam1 KD = 42 cells tracked from 4 assays. Cells were tracked in 15-min increments for 12 h.
(D) Violin plots represent migration velocity calculated from tracking traveled distances of single cells for control and Daam1 KD cells. Centerlines show the median; limits show the first and third quartiles. ***p ≤ 0.001, analyzed by unpaired t test.
(E) Wind rose plot showing migration tracks of individual control and Daam1 KD cells.

