
Figure 4. Correlations between measures of clinical improvement and reductions in FC between limbic regions and resting-state networks.
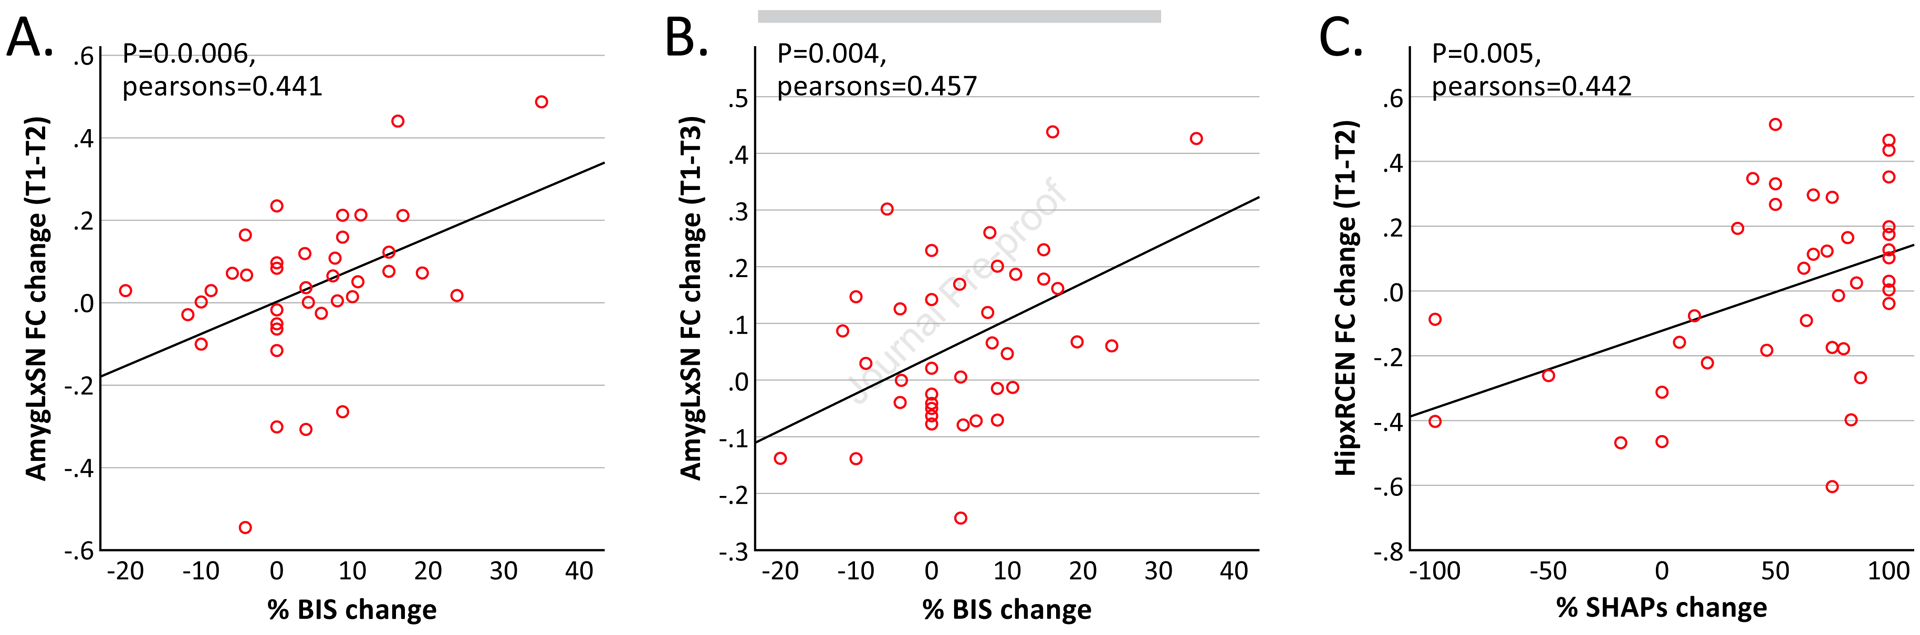
(A) Change in FC between the left amygdala (AmygL) and salience network (SN) after a single infusion of ketamine correlated with change in BIS at the end of treatment. (B) Change in FC between the AmygL and SN at the end of treatment correlated with change in BIS at the end of treatment. (C) Change in FC between the hippocampus (Hip) and right central executive network (RCEN) after a single infusion of ketamine correlated with change in SHAPs at the end of treatment. BIS, behavioral inhibition system scale; SHAPs, Snaith-Hamilton Pleasure Scale; T1, time 1 (baseline); T2, time 2 (24 hours after first infusion of ketamine); T3, time 3 (24 hours after fourth infusion of ketamine).