
FIGURE 1.
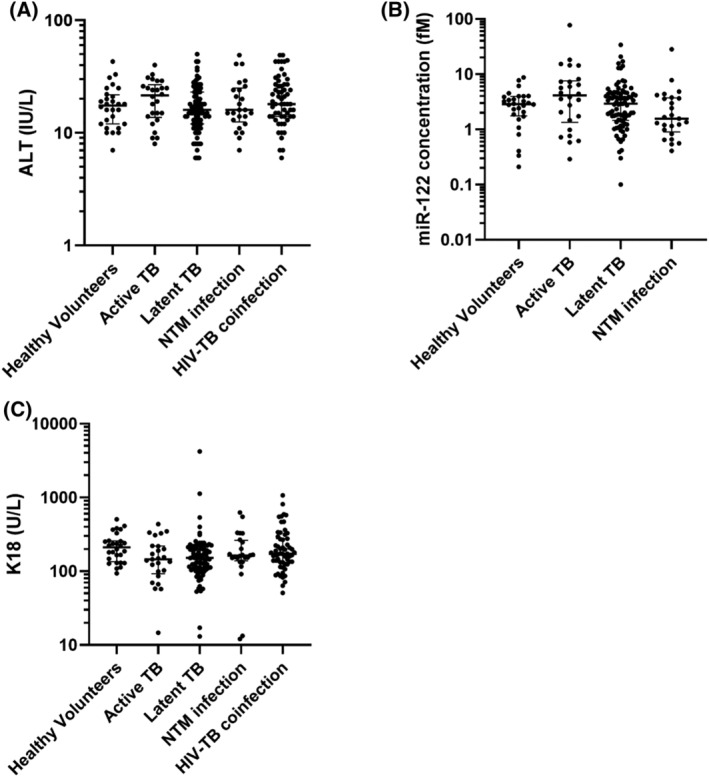
Circulating concentration of A, alanine transaminase (ALT; IU/l), B, microRNA (miR)‐122 (fM) and C, K18 (U/L). Data are the first collected samples from the ALISTER study or SAEFRIF trial. Participants include healthy volunteers (n = 28), active tuberculosis (TB; n = 26), latent TB (n = 87), nontuberculous mycobacteria (NTM) infection (n = 25) and human immunodeficiency virus (HIV)–TB coinfection (n = 59). Data are presented as dot plots. Line shows median and bars show interquartile range. The significance of differences between groups were determined by 1‐way Kruskal–Wallis ANOVA (ALT P = .2; miR‐122 P = .09; K18 P = .03)