
FIGURE 2.
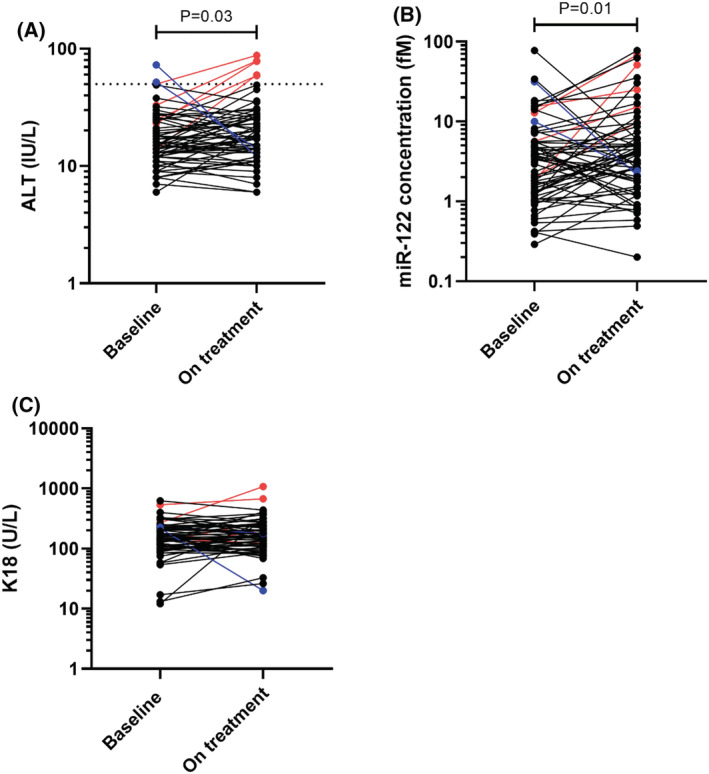
Circulating concentration of A, alanine transaminase (ALT; IU/L), B, microRNA (miR)‐122 (fM) and C, K18 (U/L) in sequential samples in patients within the ALISTER study, (active tuberculosis, n = 9; latent tuberculosis, n = 46; nontuberculous mycobacteria, n = 10) Data shown as dot plots. Black dots show patients with normal ALT activity at baseline and on treatment; blue dots show patients with ALT activity >50 U/L at baseline which decreased on treatment; red dots show patients whose ALT increased above 50 U/L with treatment. Dotted line on (A) ALT = 50 IU/L. The significance of differences between baseline and on treatment concentrations of biomarkers was determined by Wilcoxon signed rank test (ALT P = .03; miR‐122 P = .01; K18 P = .4)