
FIGURE 5.
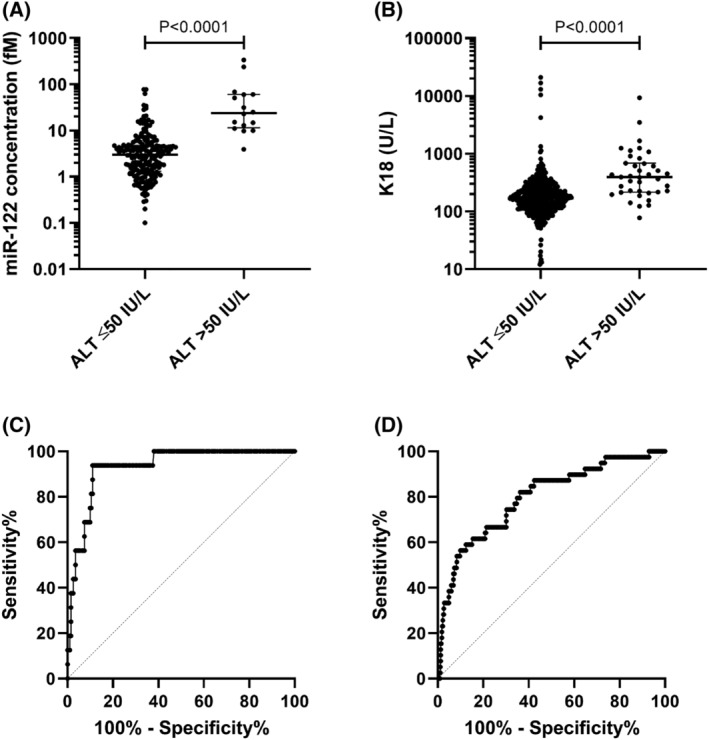
Comparison of samples grouped by normal alanine transaminase (ALT; ≤50 IU/L) and elevated ALT (>50 IU/L). A, MicroRNA (miR)‐122 concentration (fM) and B, K18 (U/L). Patient samples (healthy volunteers, n = 28; active tuberculosis [TB,] n = 44; latent TB, n = 142; nontuberculous mycobacteria infection, n = 39; HIV‐TB coinfection, n = 241). Statistical analysis of the significance of the difference between the groups calculated with the Mann–Whitney t‐test (miR‐122 P < .0001; K18 P < .0001). Receiver operator characteristic (ROC) analysis of samples grouped by normal ALT (≤50 IU/L) and elevated ALT (>50 IU/L), C, miR‐122 and D, K18. MiR‐122 (ROC‐area under the curve [AUC] = 0.93, 95% CI = 0.88–0.98, P < .001). K18 (ROC‐AUC = 0.80, 95% CI = 0.72–0.87, P < .0001)