
Figure 6: Ensemble activity arises from underlying structure.
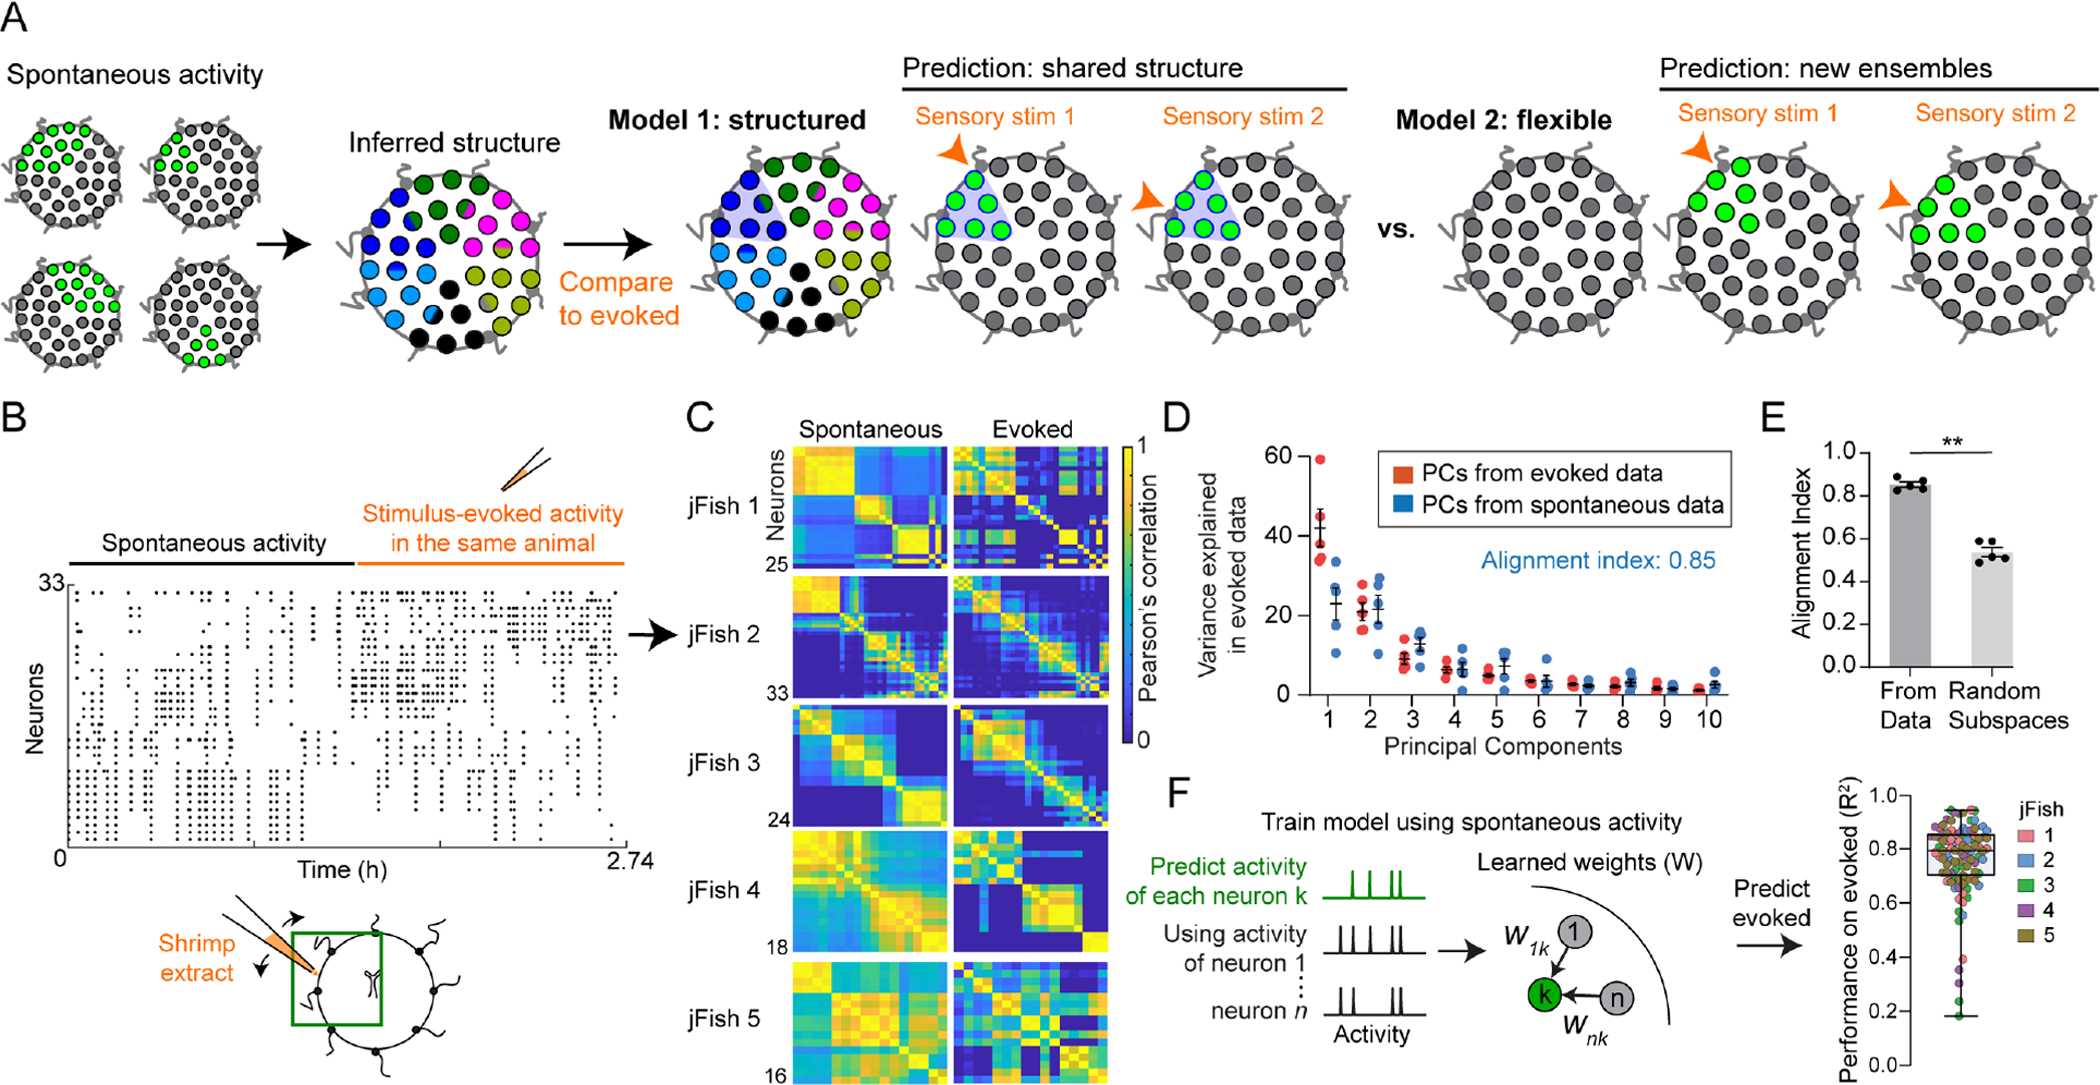
(A) Model 1 (“structured”): evoked activity uses spatial pre-patterning shared with spontaneous activity. Model 2 (“flexible”): assemblies generated de novo at each stimulus location.
(B) Example of spontaneous followed by evoked activity data. Dots indicate time of a GCaMP peak. Diagram: experiment and approximate FOV.
(C) Pairwise correlation during spontaneous (left panels) and corresponding evoked (right panels) epochs. Panel B corresponds to jellyfish 2.
(D) Variance explained in evoked data using its own principal components (PCs, orange) or those from spontaneous activity (blue). The first 5 PCs from spontaneous explain 85% of variance in evoked. Dots here and in E represent the 5 animals in C.
(E) Alignment indices, using the first 5 PCs from spontaneous to explain variance in evoked. Index is significantly higher than using PCs from random subspaces (p = 0.0079, Mann-Whitney Test).
(F) GLMs trained using only the spontaneous activity epoch; evoked neural activity could still be predicted with high accuracy (right, R2, dots: neurons from all jellyfish in C).
See also Figure S5.