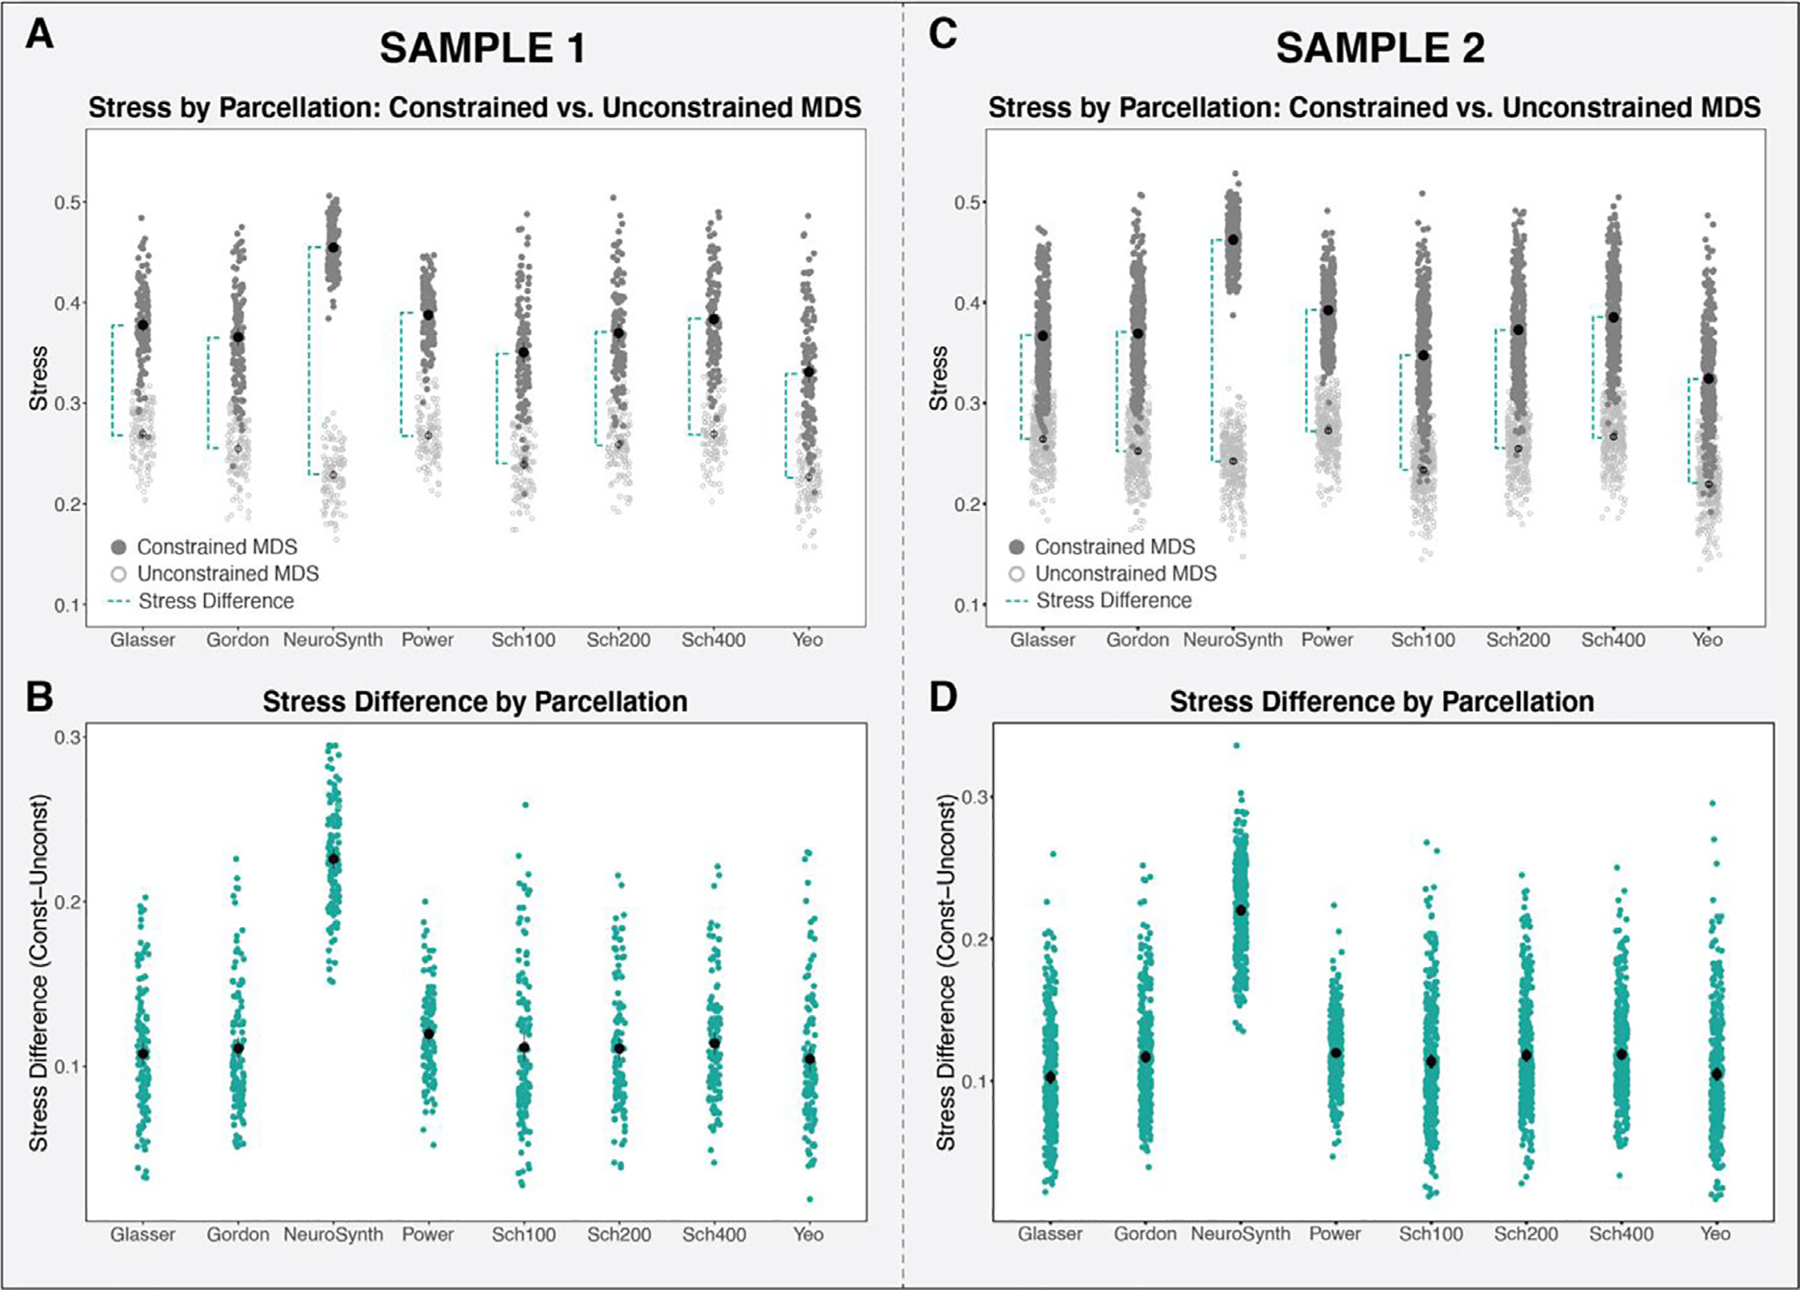
Fig. 4.

A: The stress values of the unconstrained (light gray) and constrained (dark gray) MDS solutions for each parcellation (Sample 1). The stress difference (between unconstrained and constrained MDS) is illustrated by the dashed turquoise line. B: The stress difference (constrained stress minus unconstrained stress) for each parcellation examined (Sample 1). C: The stress values of the unconstrained (light gray) and constrained (dark gray) MDS solutions for each parcellation (Sample 2). The stress difference (between unconstrained and constrained MDS) is illustrated by the dashed turquoise line. D: The stress difference (constrained stress minus unconstrained stress) for each parcellation examined (Sample 2).
