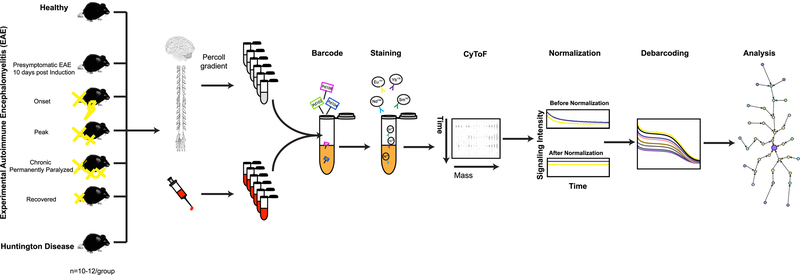
Figure 1: Schematic representation of the experimental strategy.
Immune response profiles were analyzed in Healthy, five different clinical stages of EAE, and end-stage HD. Single-cell suspensions from CNS and whole blood of each condition were prepared as described in Methods. Individual samples were simultaneously processed by using the barcoding strategy (Methods). Barcoded samples were pooled, stained with a panel of 39 antibodies (Supplementary Table 2a–c and Methods), and analyzed by mass cytometry. Raw mass cytometry data were normalized for signal variation over time and debarcoded and analyzed using the X-shift algorithm, a nonparametric clustering method that automatically identifies cell populations by searching for local maxima of cell event density in the multidimensional marker space. The result is displayed as a MST layout. In each experiment, tissues from ten mice were pooled in order to provide enough cell number (Methods). Each experiment was performed seven to ten times independently.

