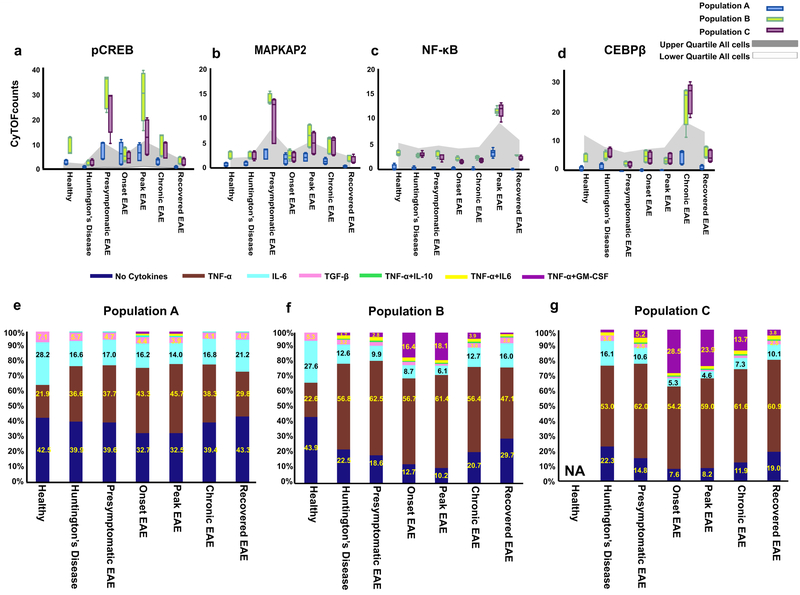
Figure 3: CyTOF analysis reveals the signaling and cytokine molecular signatures in the three CNS-resident myeloid populations under different clinical conditions.
a-d) Dynamic of key signaling molecules of immune activation pathways in the three CNS-resident myeloid populations. Box-and-whisker plots show median raw CyTOF signal intensity per population. The grey area represents the interquartile range of the given signaling molecule in all cells in a sample, averaged across replicates, and thus indicates the overall expression range for each marker. Center line is average; boxes extend to 25th and 75th percentile; whiskers extend to 5th and 95th percentiles. (n= 5 independent experiments for healthy, end-stage HD, presymptomatic EAE, Chronic EAE; n=6 independent experiments for Onset EAE, Peak EAE).
(e-g) Single-cell analysis of cytokine production by the three CNS-resident myeloid populations in response to different disease conditions. Analysis of cytokine co-expression in CNS-resident myeloid populations in healthy and diseased states demonstrating heterogeneous subsets in each population. Percentages of single-cells expressing zero, one or two cytokines are represented in a stacked bar graph (n=3 independent experiments).

