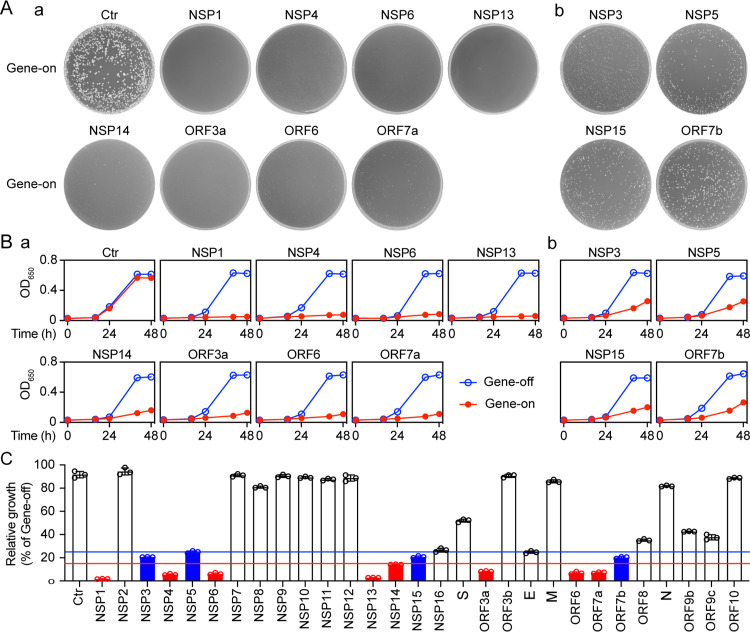
Figure 1 |. The effect of SARS-CoV-2 protein on cell proliferation.
Effect of SARS-CoV-2 expression on fission yeast colony formation. (A), cellular growth (B) and summary of the relative cellular growth (15%, red; 25% blue) of each of the SARS-CoV-2 protein-expressing cells (C). The name of each SARS-CoV-2 protein is labeled above each agar plate. An empty pYZ1N vector (Ctr) was used as a control. Gene-off, no SARS-CoV-2 protein production; gene-on, the specific SARS-CoV-2 protein production was induced by triggering the nmt1 promoter-mediated gene transcription. Fission yeast colony formation was measured by growing SARS-CoV-2 protein-expressing fission yeast cells on the selective EMM agar plates and incubated at 30°C for 3–5 days before the pictures were taken. Cell proliferation analysis was carried out by comparing cellular growth between the SARS-CoV-2 protein-producing cells and the SARS-CoV-2 protein-suppressing cells over time. Cell growth was measured by spectrophotometry (OD650). Only the effect of those SARS-CoV-2 proteins that showed complete (NSP1, NSP4, NSP6, NSP13, NSP14, ORF3a, ORF6 and ORF7a) or nearly complete (NSP3, NSP5 and NSP15) inhibition of yeast colony formation is shown in (A) and thereafter. Complete data on cell proliferation are included in Figure S2. Each experiment was repeated at least three times and the standard errors of each time point were calculated.

