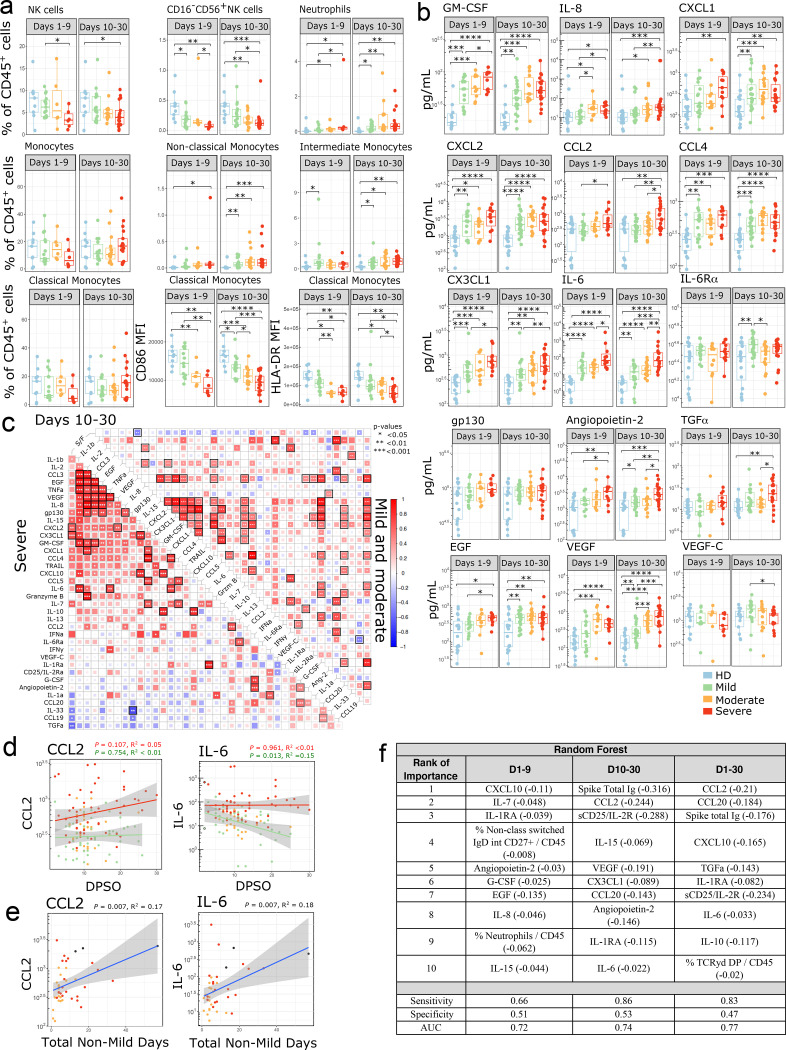
Figure 3:
Innate immune changes in SARS-CoV-2 infection (a) Immune cell subsets related to the innate immune response are shown. Boxplots show percentages of each cell population out of live CD45+ cells or MFI of indicated markers. Where multiple timepoints within the early (D1–9) or late (D10–30) phase per patient were available, the mean was taken and each patient is represented by one dot per time phase. n = 9 for HD, n = 15, 6, 6 for mild, moderate, and severe, respectively in the early phase, and n = 18, 15, 17 for mild, moderate and severe in the late phase. (b) Peak cytokine and chemokine levels are shown during the early phase (days 1–9 from symptom onset) and late phase (days 10–30 from symptom onset) of disease in SARS-CoV-2 infection compared to non-infected healthy controls. Each dot represents maximum value per individual subject during each phase of disease (early phase: mild, n=15; moderate, n=10; severe, n= 11 and late phase: mild, n=23; moderate, n=16; severe, n= 19 and non-infected healthy controls, n=18). (c) Correlations between cytokines from days 10–30 for COVID-19 patients were calculated and clustered hierarchically. S/F ratio is fixed as the first column for comparison. Samples were stratified by disease severity. Spearman correlation coefficients were quantified by the scale of color and size of colored squares; significance of the correlation is labeled with * (P < 0.05), ** (P < 0.01), and *** (P < 0.001). Black border represents a false-discovery rate (FDR) < 0.05 (d) Kinetics of cytokine expression over time (days post symptom onset) from mild (green, n = 33), moderate (orange, n = 19), and severe (red, n = 23) patients. Multiple timepoints per patient plotted when available. Linear regression for cytokine values over time in severe (red) and mild (green) patients shown. (e) Peak individual levels of CCL2 and IL-6 are shown as linear correlation with the sum of days each patient spent hospitalized with a moderate or severe S/F ratio, termed “total non-mild days”. Each dot represents maximum cytokine value per individual subject; maximal disease severity indicated by color (moderate [orange], n=20; severe [red], n= 19, deceased [black], n= 3). (d-e) Shaded areas represent 95% confidence interval. (f) The top 10 ranked immune parameters associated with severity per the Random Forest model are tabulated for early phase (days 1–9 from symptom onset) and late phase (days 10–30 from symptom onset) and all time-points (day 1–30 from symptom onset). The linear regression R2 value for each variable is shown in parenthesis, indicating the amount of variation in disease severity that can be explained by this variable alone. +/− denotes direction of association, + indicating the higher the variable the higher (i.e., less severe) the S/F ratio, and - indicating the higher the variable the lower the S/F ratio (i.e. the more severe the disease). Sensitivity, Specificity and AUC are shown. (a-b) Significance was determined by two-sided Mann Whitney Wilcoxon test and p-values are indicated by asterisks (*, p ≤ 0.05; **, p ≤ 0.01; ***, p ≤ 0.001, ****, p ≤ 0.0001).

