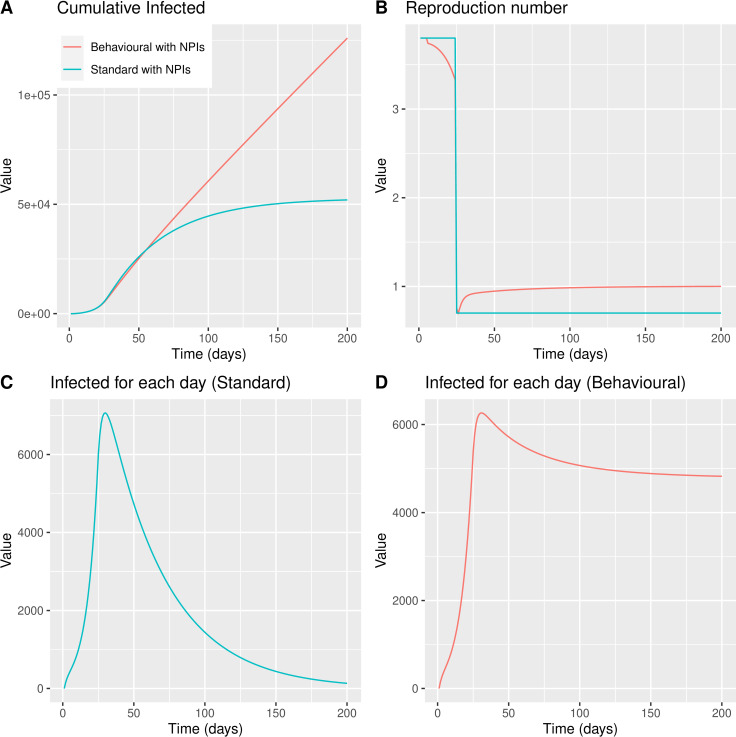
Fig 3. BeSEIR vs standard SEIR with NPIs implemented on Day 24.
Panel A shows the cumulative infected people as predicted with the standard SEIR model–blue line vs the behavioural SEIR model–red line. Panel B shows the reproduction number over time. Panel C shows the infected people at any time point as predicted by the standard SEIR. Panel D shows the infected people at any time point as predicted by the behavioural SEIR.

