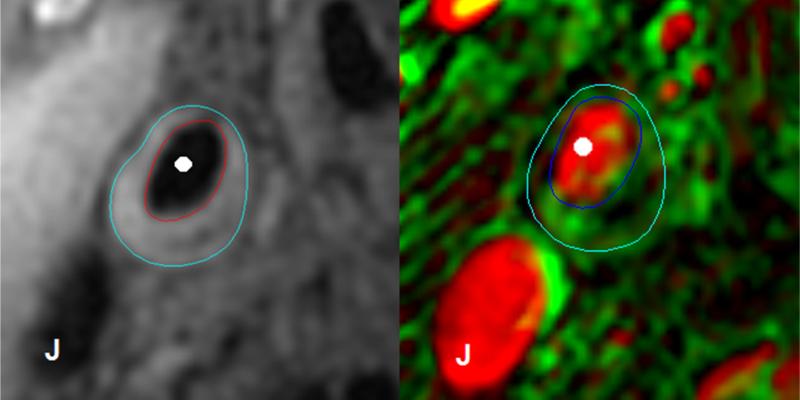
Figure 1. Pre-contrast T1-weighted image of the common carotid artery (left panel) and corresponding vasa vasorum (V-V) image derived from dynamic contrast-enhanced magnetic resonance imaging (DCE-MRI) (right panel) of a study subject.
As described in the Image Analysis section of the methods, the lumen and outer wall boundaries were initially drawn using the structural multi-contrast images (red and blue boundaries in the left panel, respectively). These contours were then mapped to the DCE-MRI images and manually adjusted slightly to better fit the image, resulting in the final lumen and outer wall boundaries for DCE-MRI processing (dark and light blue boundaries in the right panel, respectively). The white circles indicate the arterial lumen and the “J” symbols indicate the jugular vein on both images. The Patlak pharmacokinetic model parameters Vp and Ktrans are shown in red and green, respectively, as previously described26. Brighter pixels indicate larger values.

