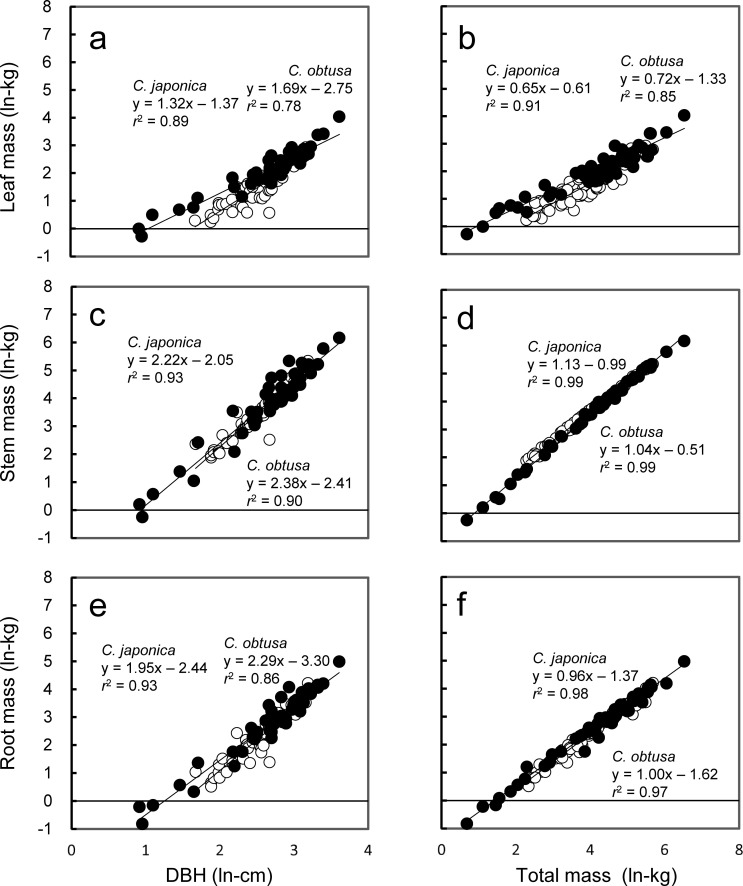
Fig 4.
Organ biomass in relation to DBH (a, c, e) and total mass (b, d, f). Differences in regressions between species were tested by analysis of covariance (ANCOVA, [69]). There were significant interspecific differences between leaf biomass and DBH or total biomass (P < 0.0001) and stem biomass and total biomass (P < 0.05), though the other relations were similar between species (P > 0.05).

