
Figure 2.
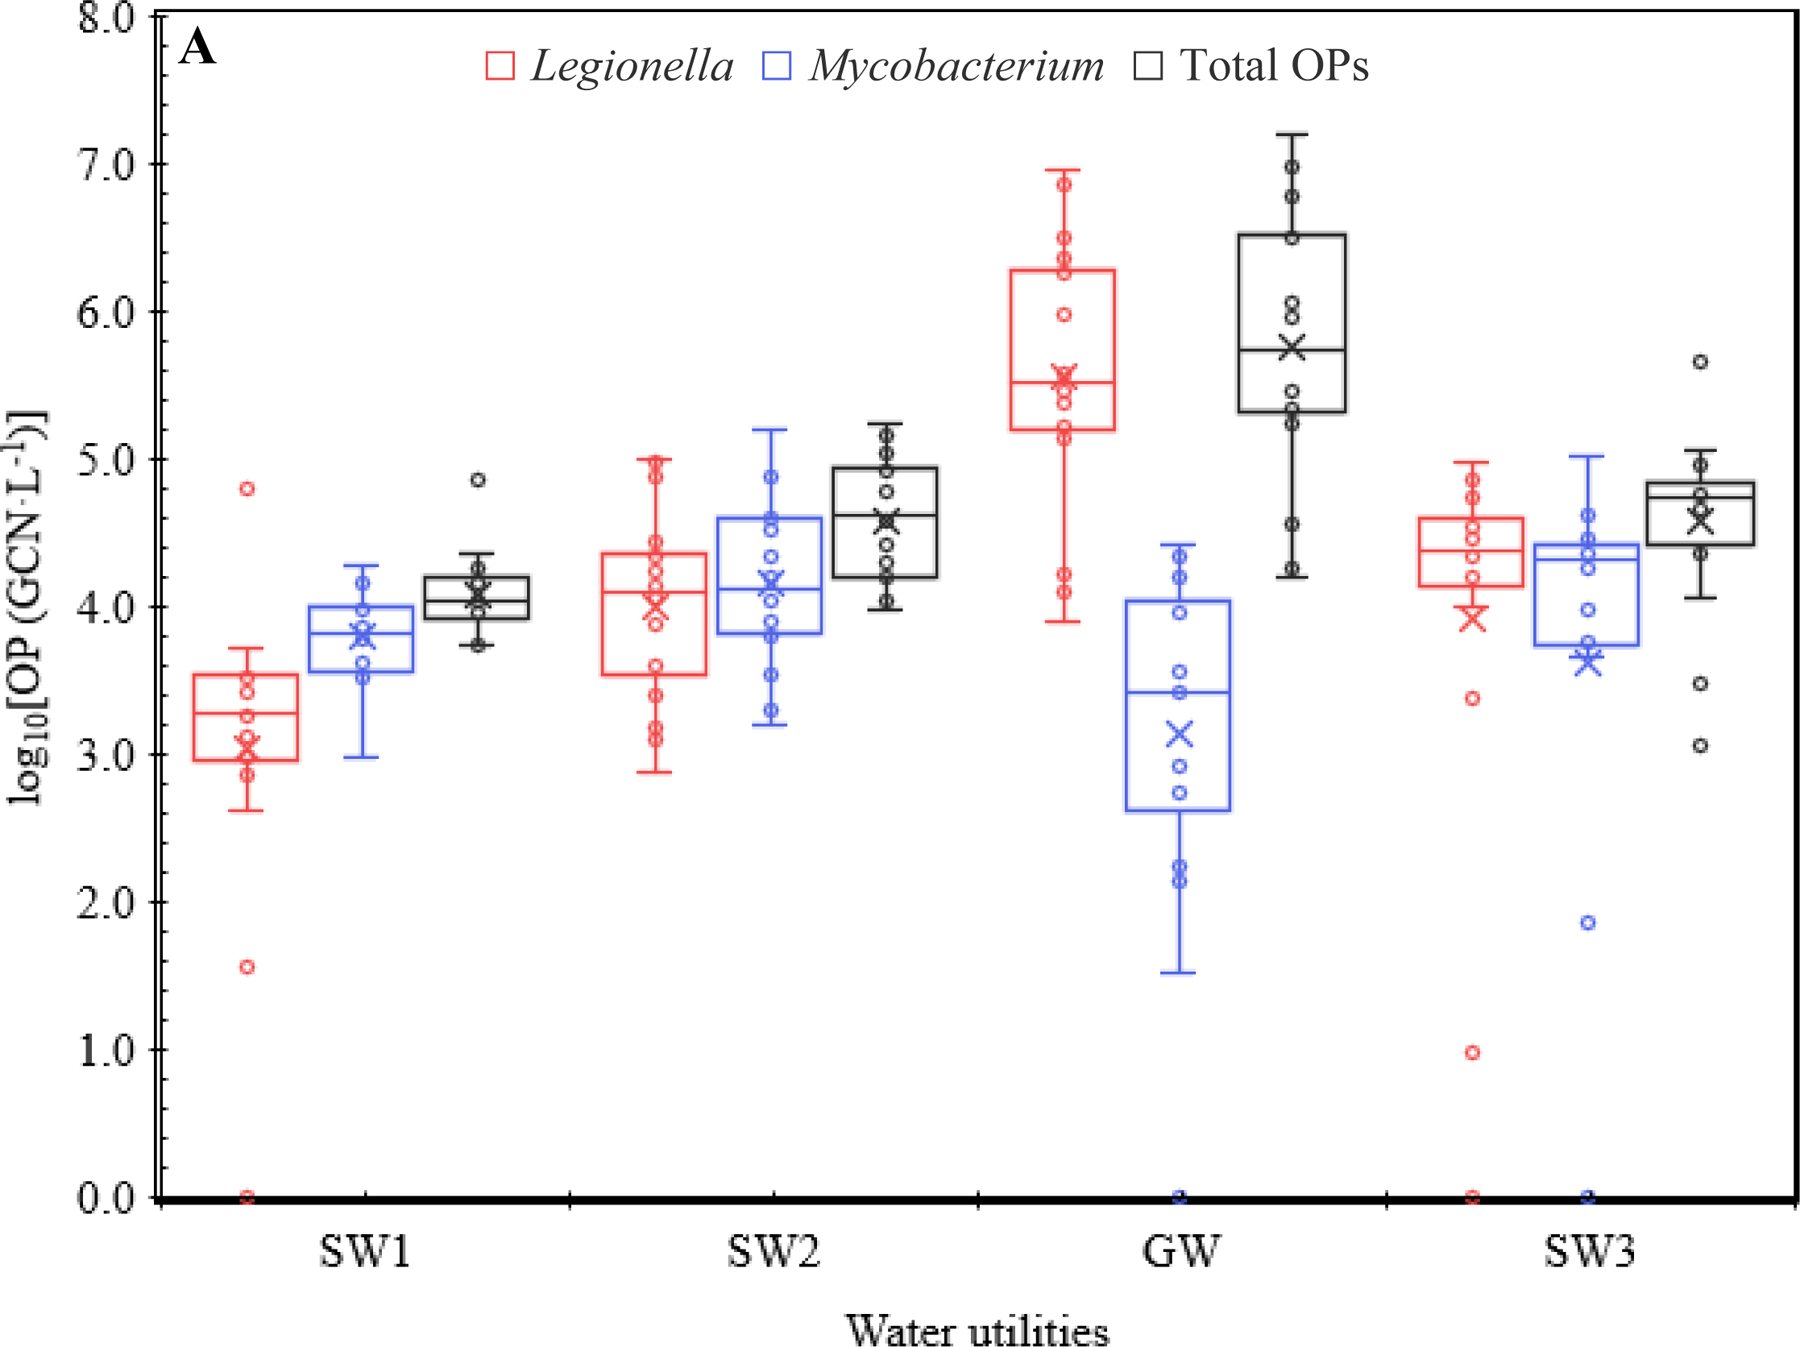
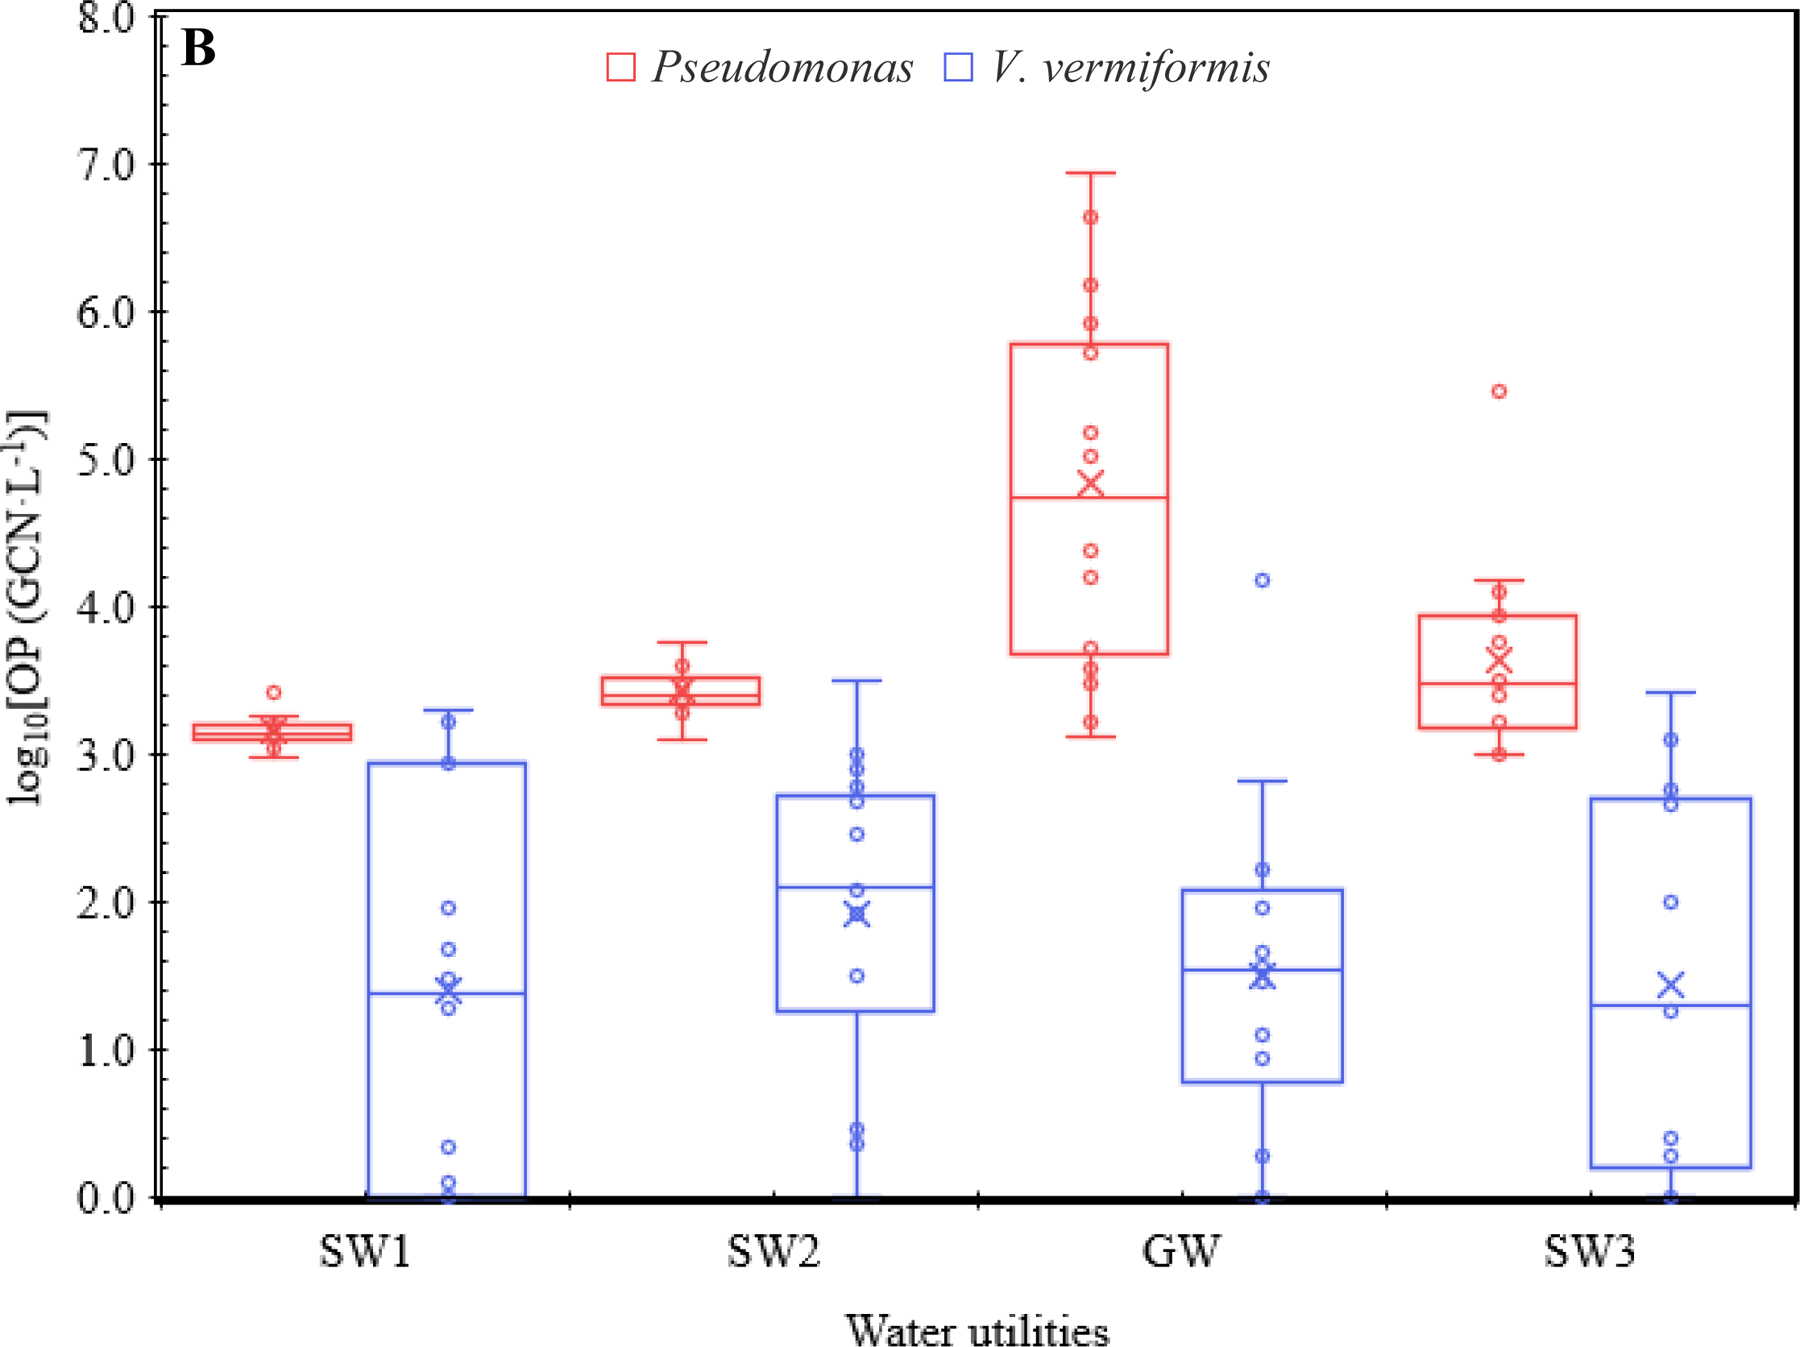
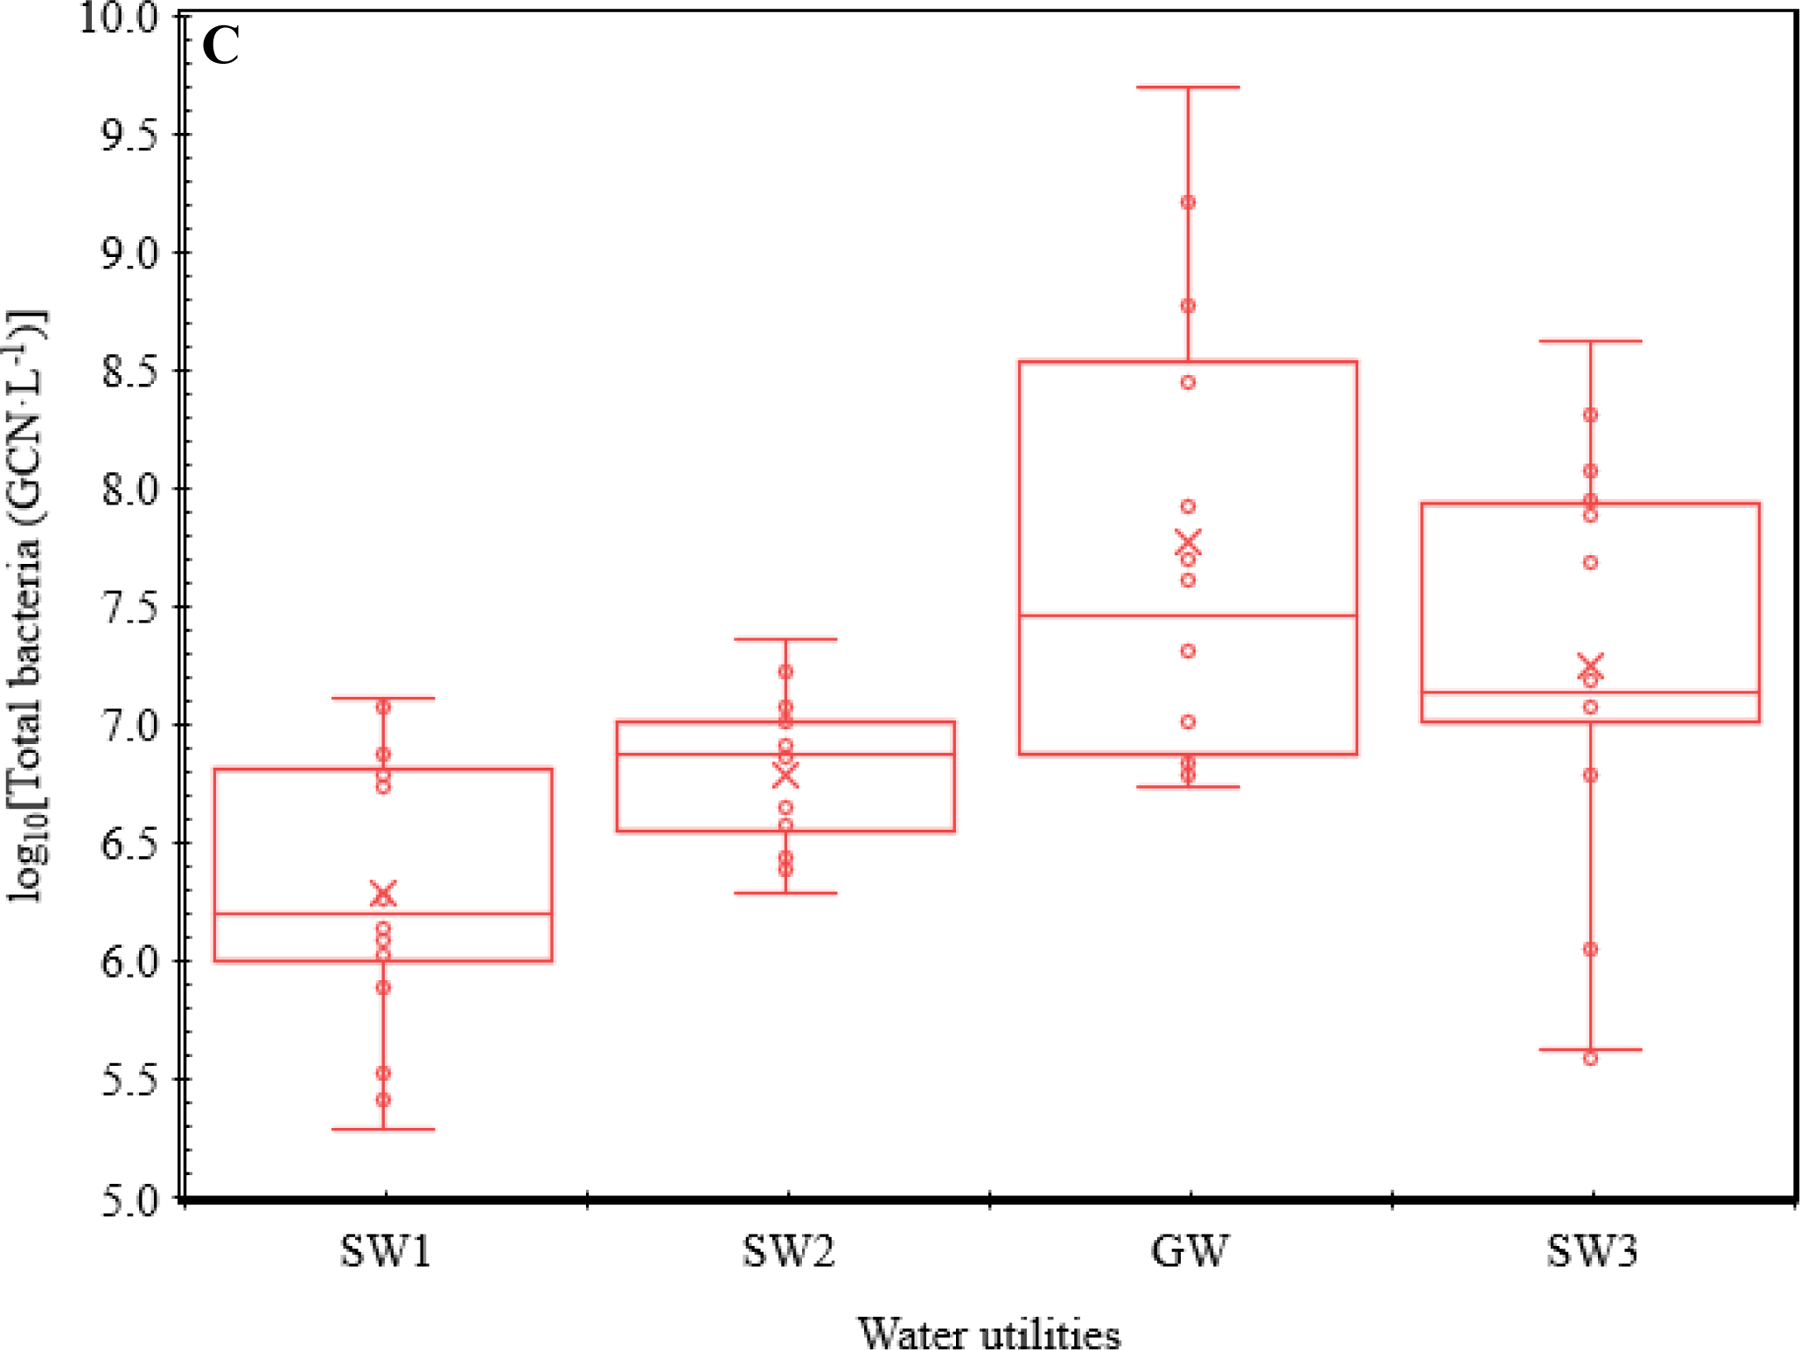
Box-and-whisker plots for the log10-transformed concentrations of (A) Legionella, (A) Mycobacterium, (B) Pseudomonas, (B) V. vermiformis, (A) total OPs, and (C) total bacteria in the four CDWDSs. The lower and upper box boundaries represent the first and third quartiles, respectively. The line inside a box: Median. The cross sign inside a box: Arithmetic mean. The lower and upper error lines: The lowest and highest observations, respectively. Both inner and outlier points (the open circles) are shown. The calculation of the quartiles included the median.