


Figure 4.
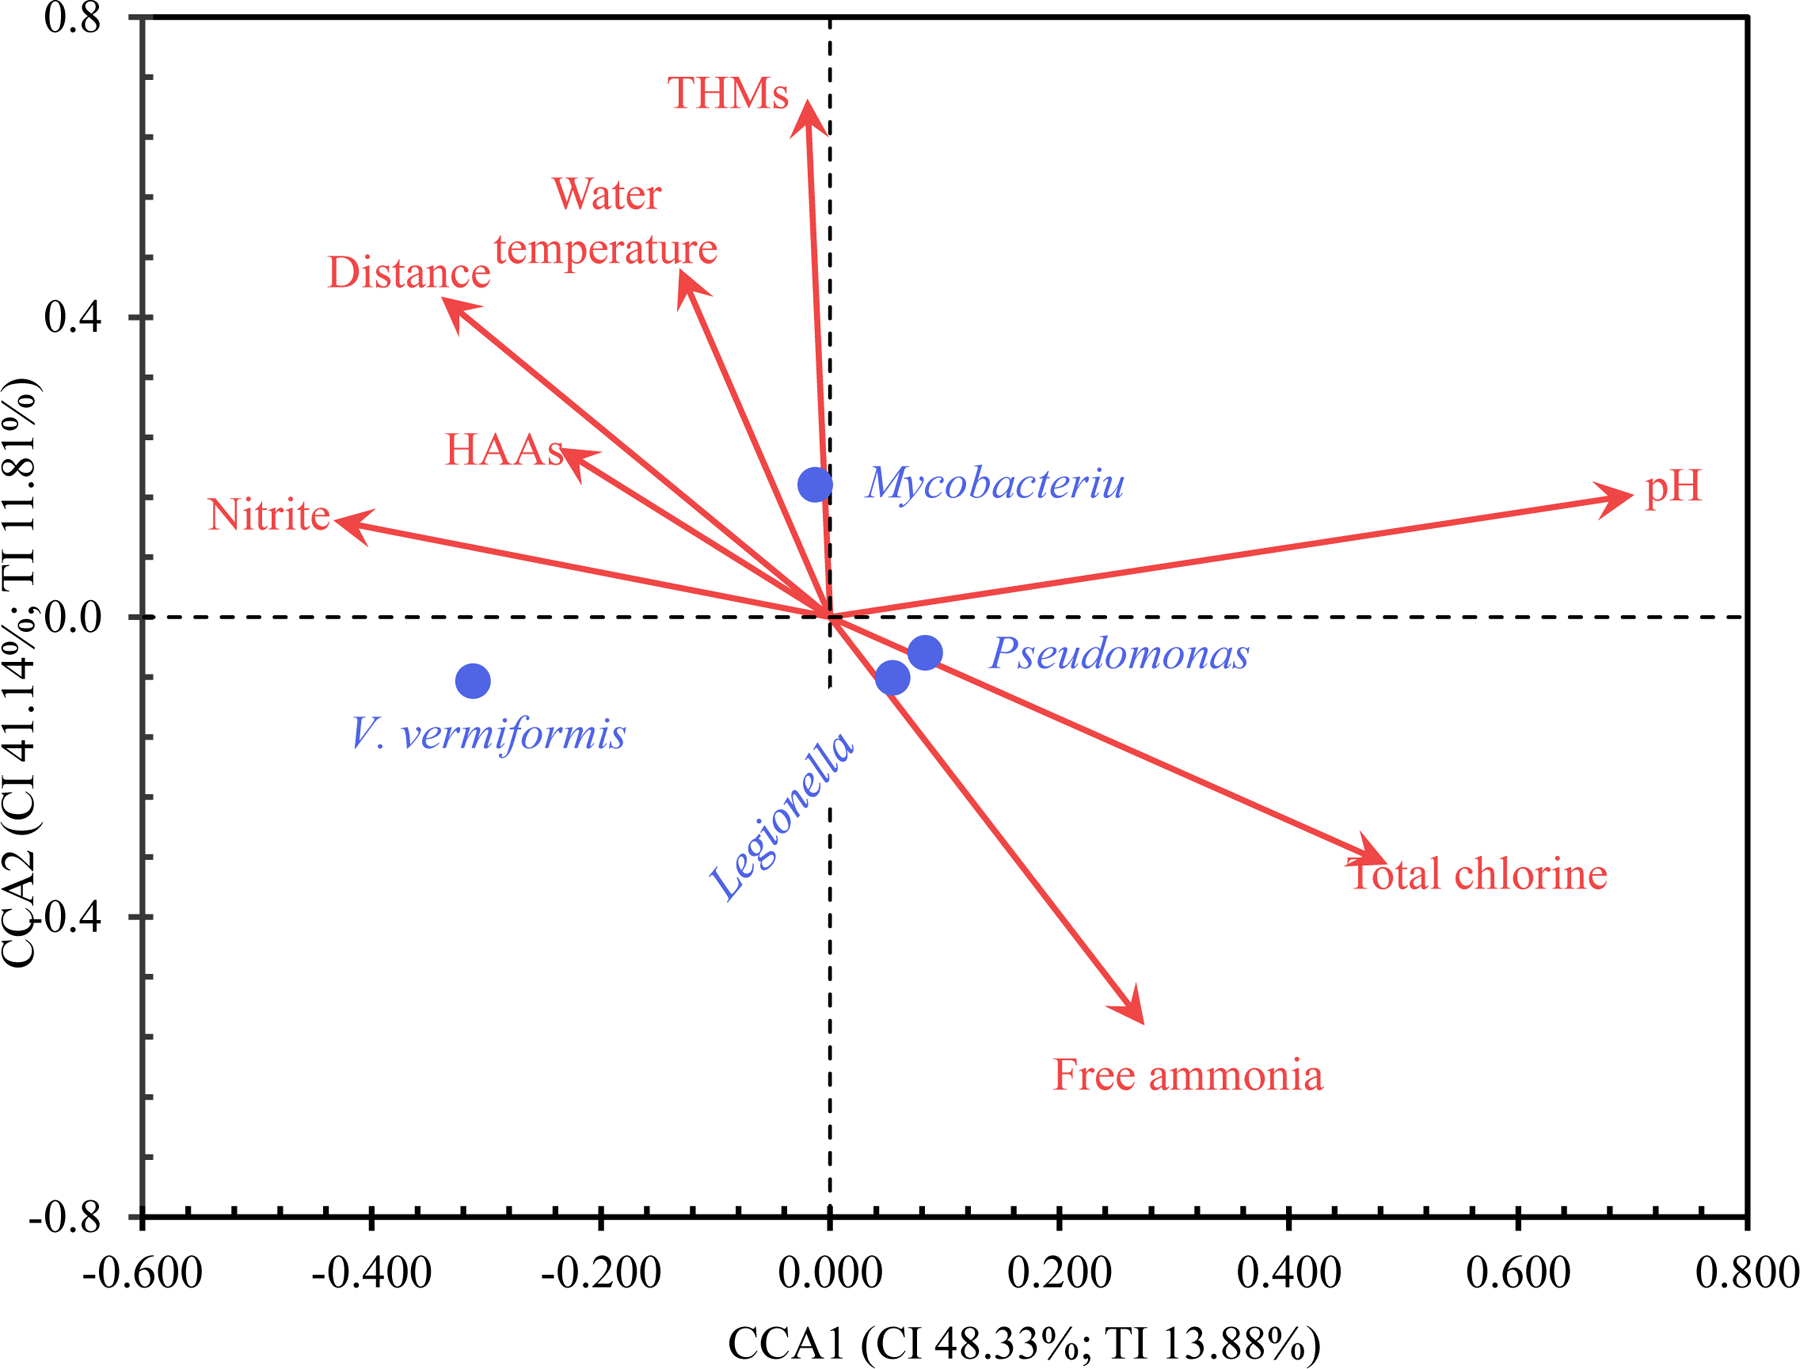
A CCA plot (conducted with XLSTAT) for the relationship between eight physicochemical water quality parameters and log10-transformed OP concentrations (unit: GCN·L−1). Missing values were replaced with arithmetic means before the analysis. CI: Constrained inertia. TI: Total inertia. CCA1, CCA2, and CCA3 explained 48.33%, 41.14%, and 10.52% of the CI, respectively. CCA1, CCA2, and CCA3 explained 13.88%, 11.81%, and 3.02% of the TI, respectively.