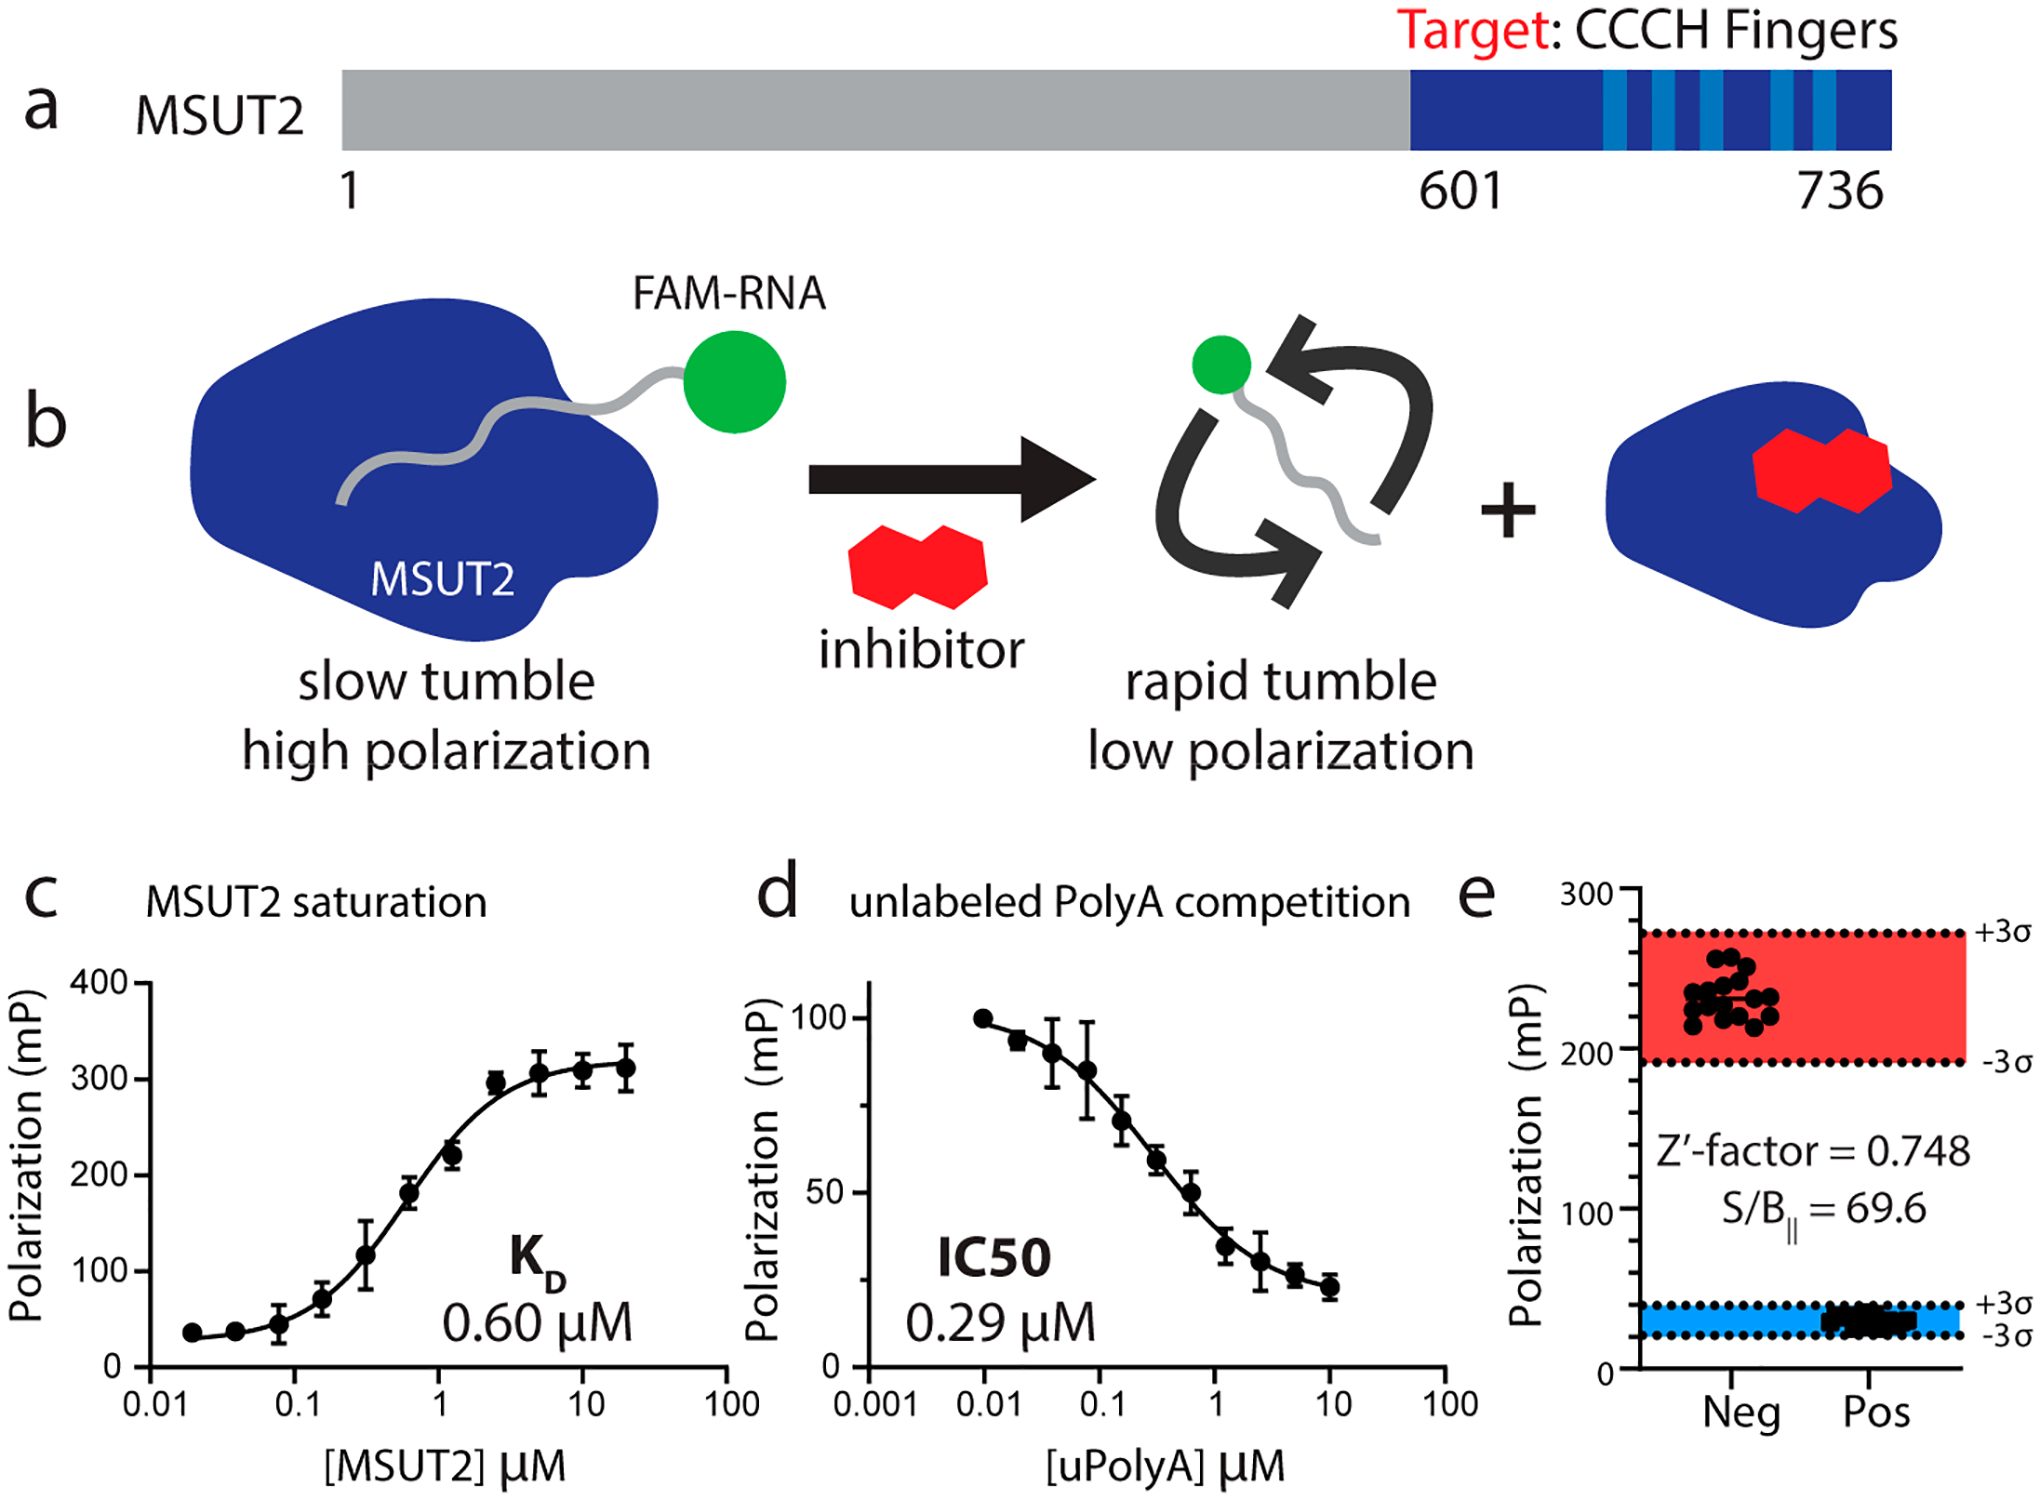
Figure 1.

(a) Schematic of MSUT2 (ZC3H14). Targeted construct consisted of only the c-terminal end (dark blue and amino acids 601–736) of MSUT2. Five CCCH finger domains are indicated (light blue). (b) Fluorescence polarization depicting MSUT2 (dark blue) bound to FAM labeled RNA emitting highly polarized light and free FAM-RNA emitting low levels of polarized light after disruption by the inhibitor. (c) Saturation assay holding FAM-RNA concentration constant at 10 nM and increasing concentrations of MSUT2. Curve fitted using a 4-parameter nonlinear regression model (Y = bottom + (top − bottom)/(1 + (IC50/X)HillSlope), with 36 data points (x,y values) analyzed at N = 3 for each point, R2 = 0.9792. (d) Competition assay with MSUT2 concentration at 125 nM and FAM-RNA at 10 nM with increasing concentrations of unlabeled poly(A)15. Curve fitted using a 4-parameter nonlinear regression model (Y = bottom + (top − bottom)/(1 + (IC50/X)HillSlope), with 36 x,y values analyzed at N = 3 for each point, R2 = 0.9630. (e) Z′-factor bar graph showing negative controls on the left and positive controls on the right. Three standard deviations on either side of the means are indicated, and Y-axis values are polarization values in units of mP. Mean of Neg column, 231.8 and mean of Pos column 30.24, N = 17 for each group. Z′-factor determined to be 0.748. Signal to background ratio was determined to be 69.6.
