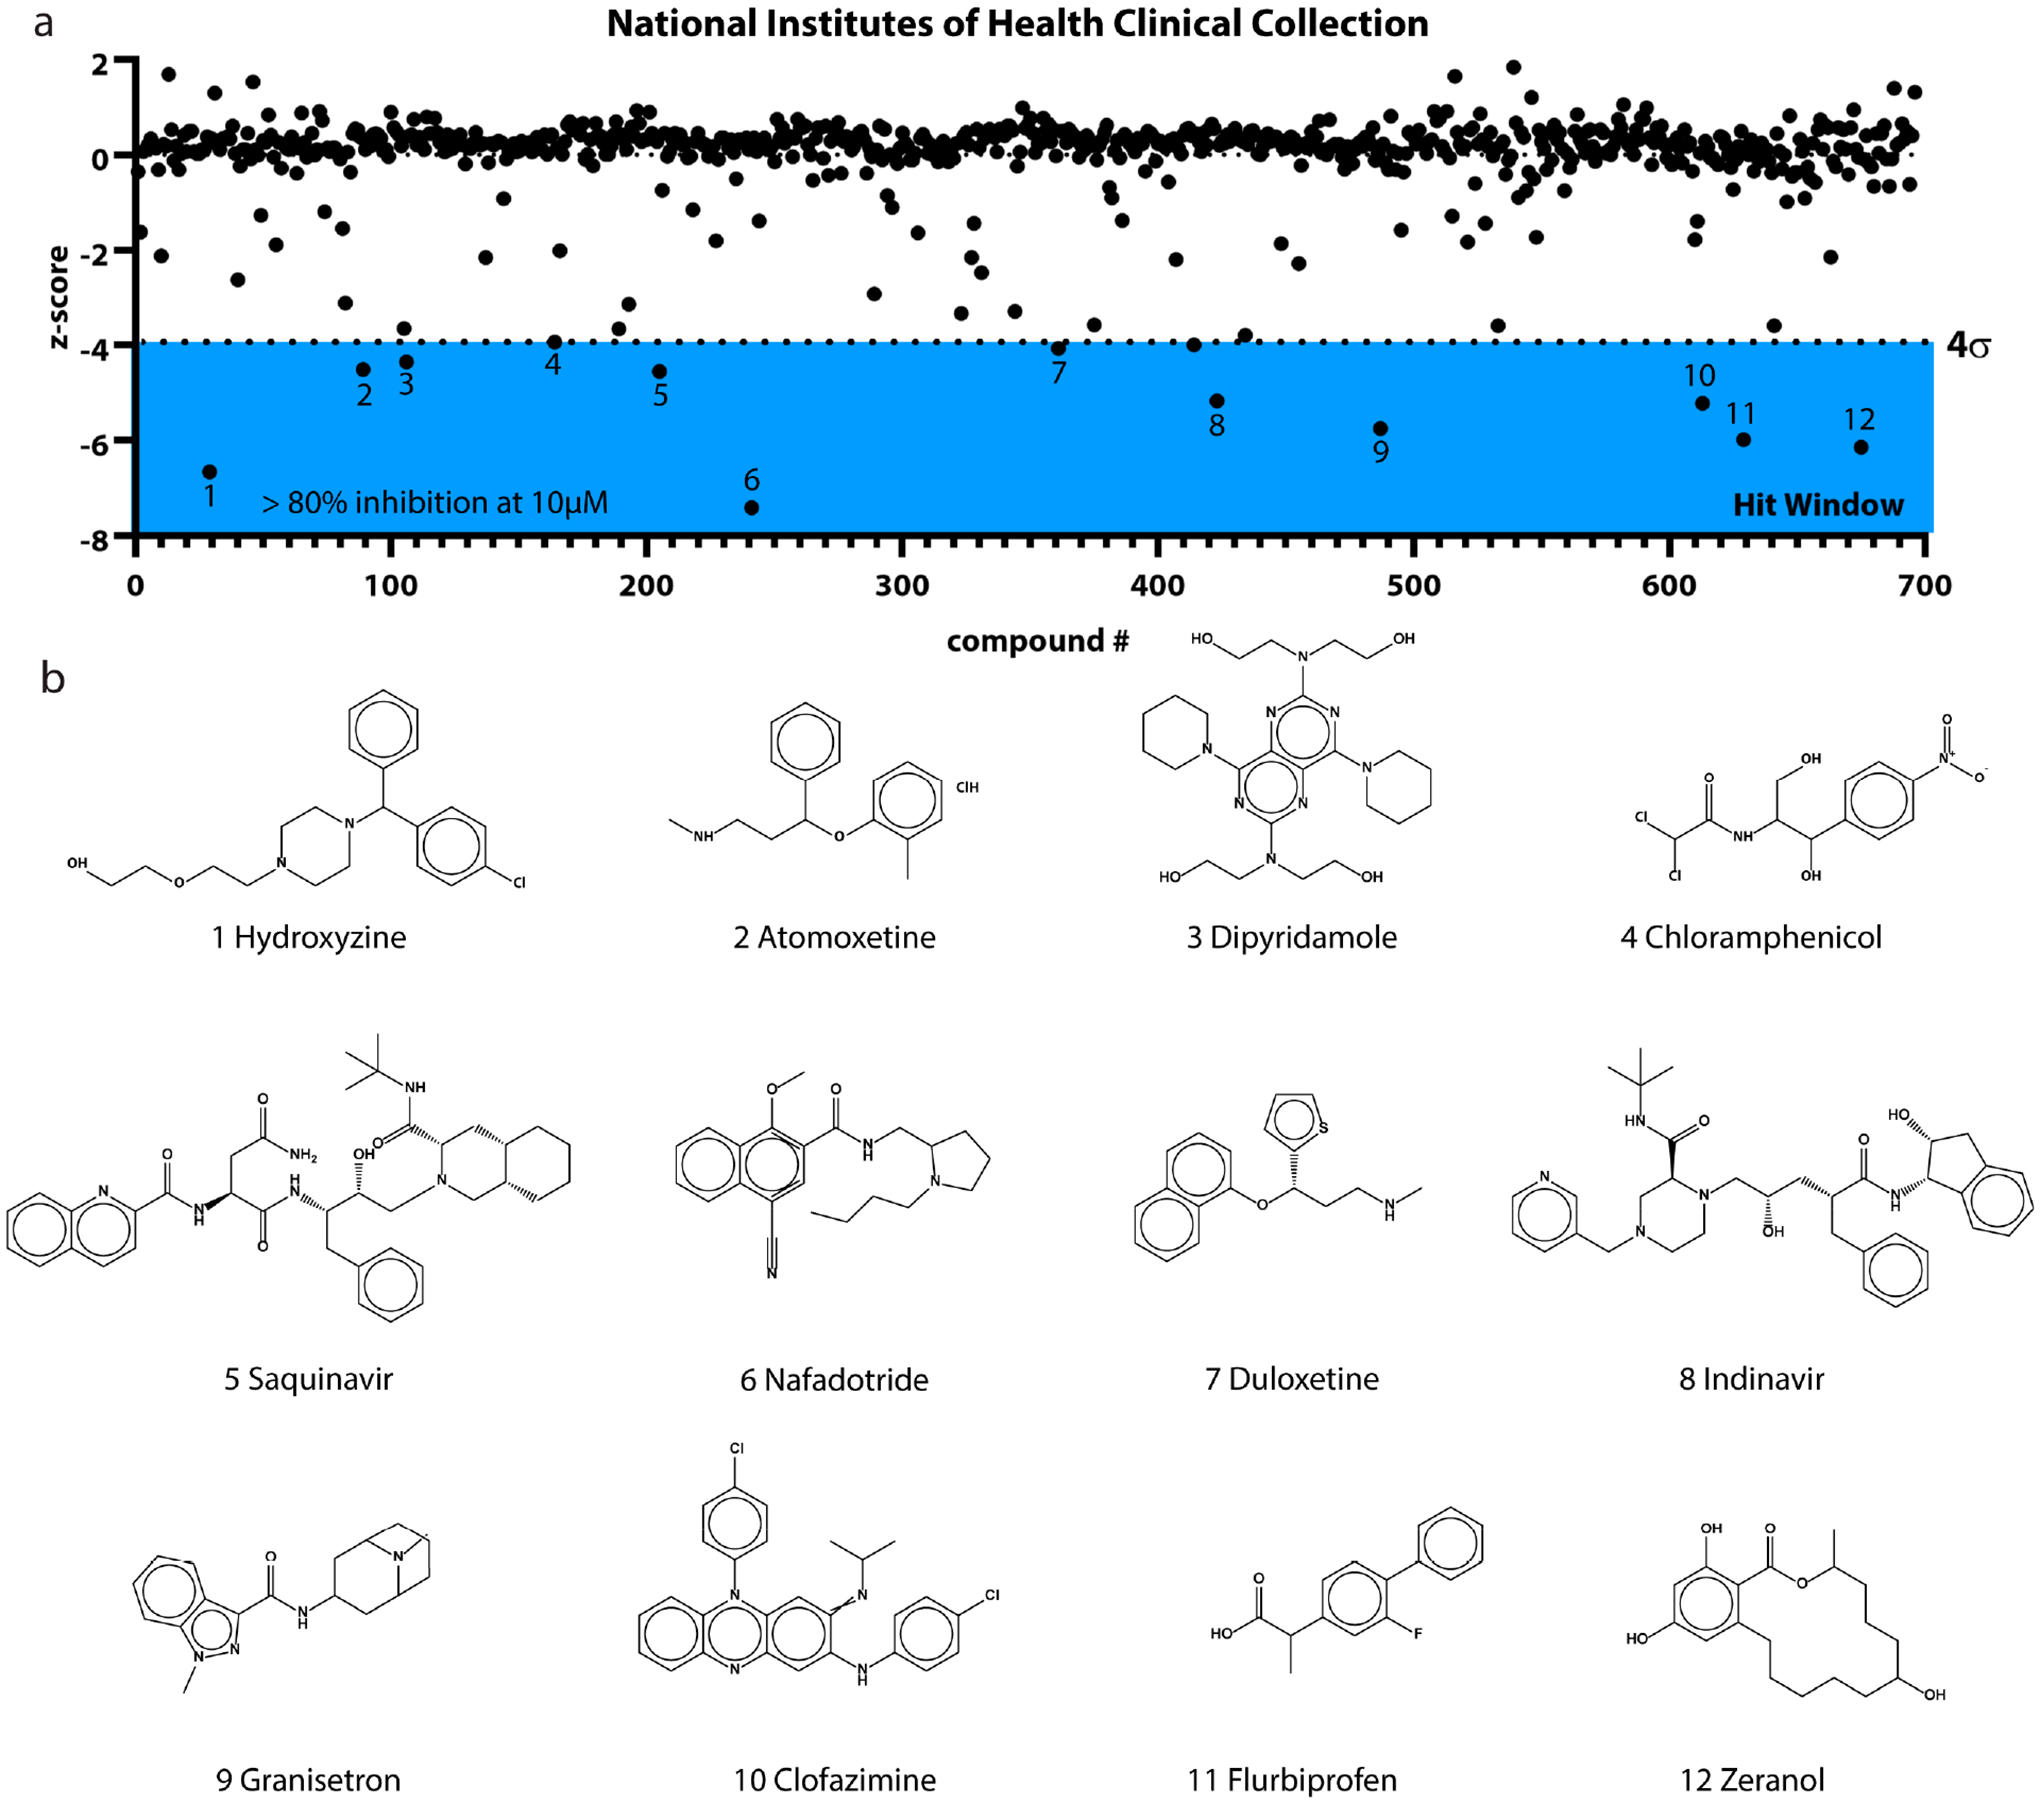
Figure 3.

(a) Graph depicting the fluorescence polarization screen of NIH Clinical Collection compounds at 10 μM. Hit window (blue) began below −4σ (standard deviations) from the mean and included 12 primary hits. (b) Structures of compounds identified through the primary screen.
