
Figure 6.
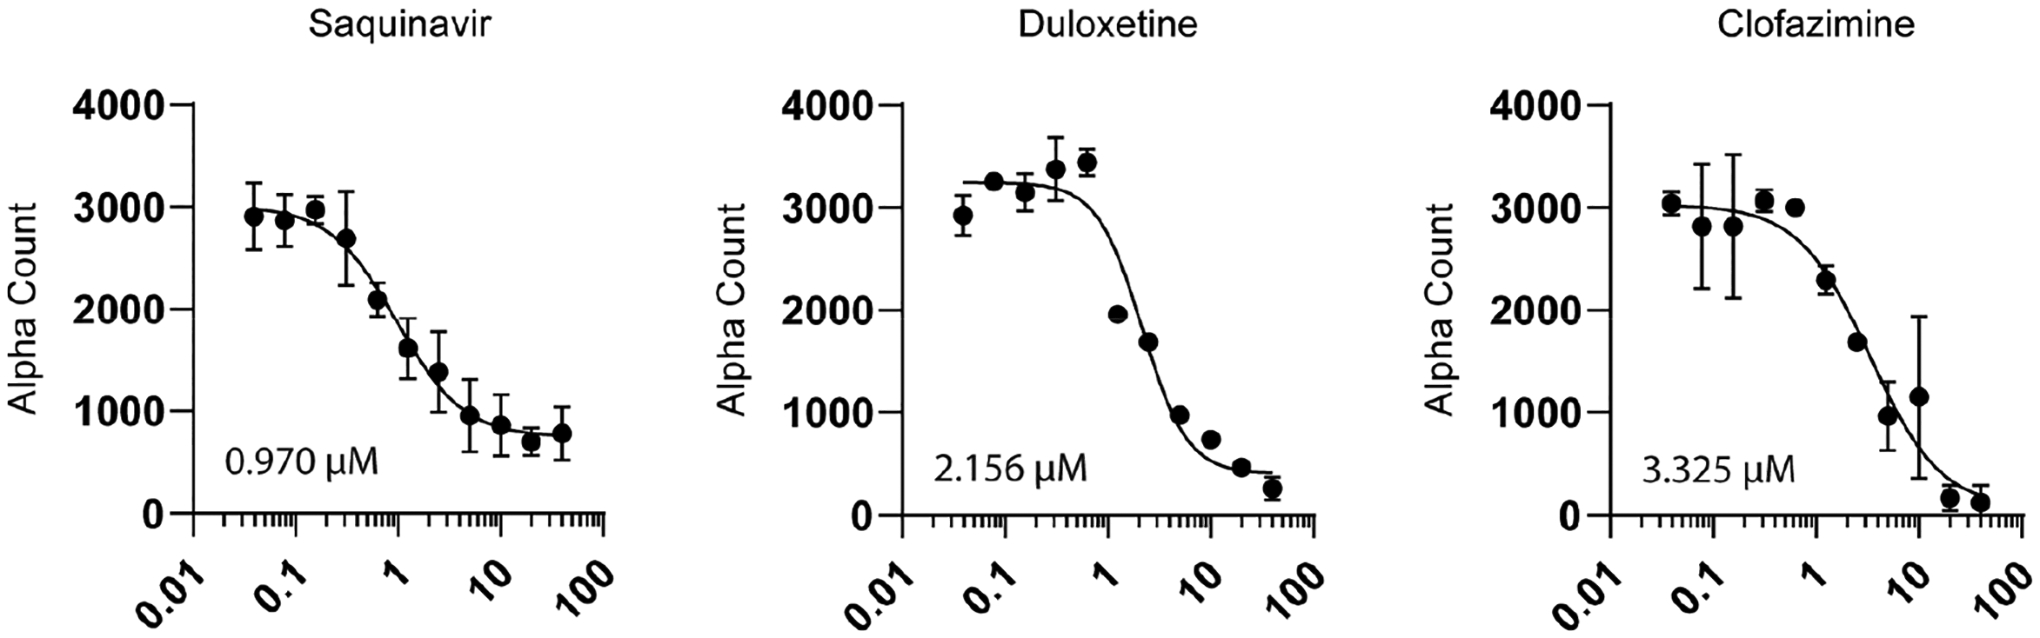
Alpha assay orthogonal dose–response validation where Y-axis is alpha count for compounds which showed dose–response activity. Relative IC50 was determined through a variable slope nonlinear regression model using the equation Y = bottom + (top − bottom)/1 + (IC50/X)HillSlope. Line fitting was performed using GraphPad Prism8 analysis tools. Twenty-two x,y values were analyzed for each compound, N = 2 biological replicates at each point.