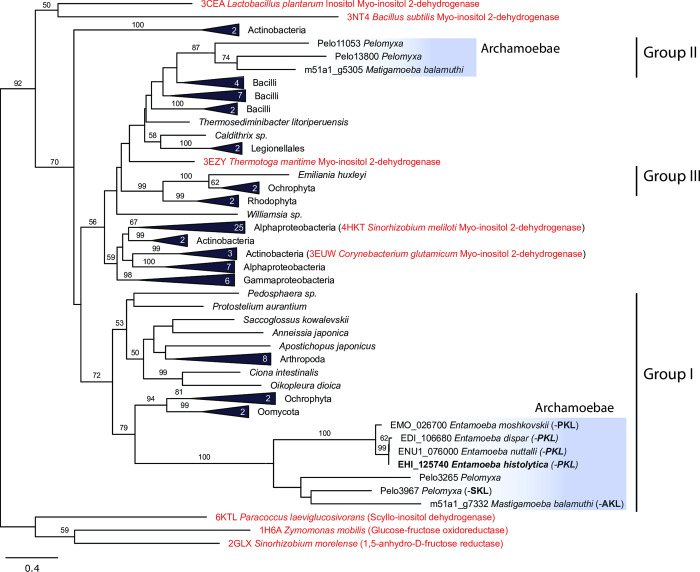
Fig 12. Phylogeny of myo-IDH.
The maximum likelihood tree was inferred with IQ-TREE using 103 protein sequences and 289 positions. Bootstrap support is given at nodes. Sequences with known crystal structures are highlighted in red. Numbers in triangles indicate the number of included sequences. PTS1 triplet is given in brackets.

