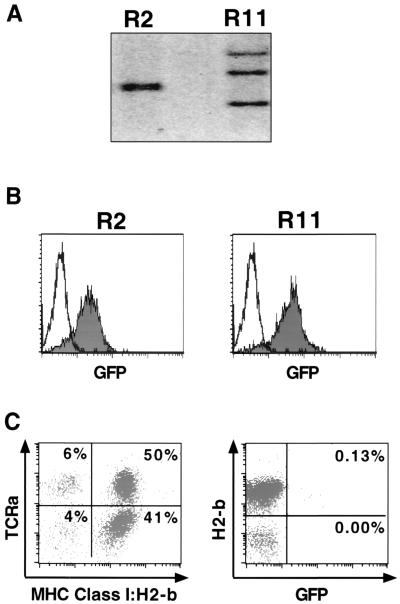
FIG. 4.
Retrovirally infected, GFP-expressing ES cells generated nonexpressing mice. (A) Two retrovirally infected clones sorted for GFP expression were analyzed for proviral integrants by Southern blot analysis. R2 contained two integrants, while R11 contained three. Uninfected cells are negative. (B) The clones were passaged after sorting for GFP-expressing cells by flow cytometry and reanalyzed for GFP expression. Both R2 and R11 express GFP (shaded) compared to uninfected controls (unshaded). (C) PBMCs from the R2 chimera (more than 50% contribution by coat color) were analyzed by flow cytometry. ES cell contribution to the chimera was determined by phycoerythrin-H2-b staining and cyc-TCRa staining and demonstrated contribution to the T-cell compartment. The percentage of cells in each quadrant is listed. The cells were also monitored for GFP expression. The percentage of GFP+ cells that are either major histocompatibility complex (MHC) class I H2-b+ (ES cell derived) or H2-b− (blastocyst derived) is listed in the quadrant.

